


Monthly Portfolio Update - March 2025
A decent month despite market turmoil

After a strong January with a 4.63% monthly gain, significantly outperforming the markets, February has been decent despite market turmoil. I am particularly pleased with my small-cap portfolio, which has remained in positive territory.
If you are curious or missed out, you can find my method here and how to react in case anything bad happens here.
In this section, I present a transparent monthly update of my portfolio. It adheres to my investment strategy. This presentation is divided into several parts:
Global view of the portfolio’s valuation and metrics
For dividend enthusiasts, a presentation of the Projected Annual Dividend Income (PADI) and a monthly calendar
Sector and geographical breakdown
My positions, fair price, price targets and moves
Overall performance
Large-cap portfolio

Following market consolidation, the large-cap portfolio also underwent a period of consolidation. Earnings reports led to widely varying performances among its stocks, with some disappointments and some very satisfying results. Overall, the portfolio remains well-balanced. My cash position has slightly increased as well, as I find the market particularly expensive and struggle to identify strong opportunities in this segment.
I sold several stocks with disappointing earnings reports, as they no longer aligned with my investment thesis. This makes the performance even more notable, given that these stocks significantly underperformed.
Small-cap portfolio
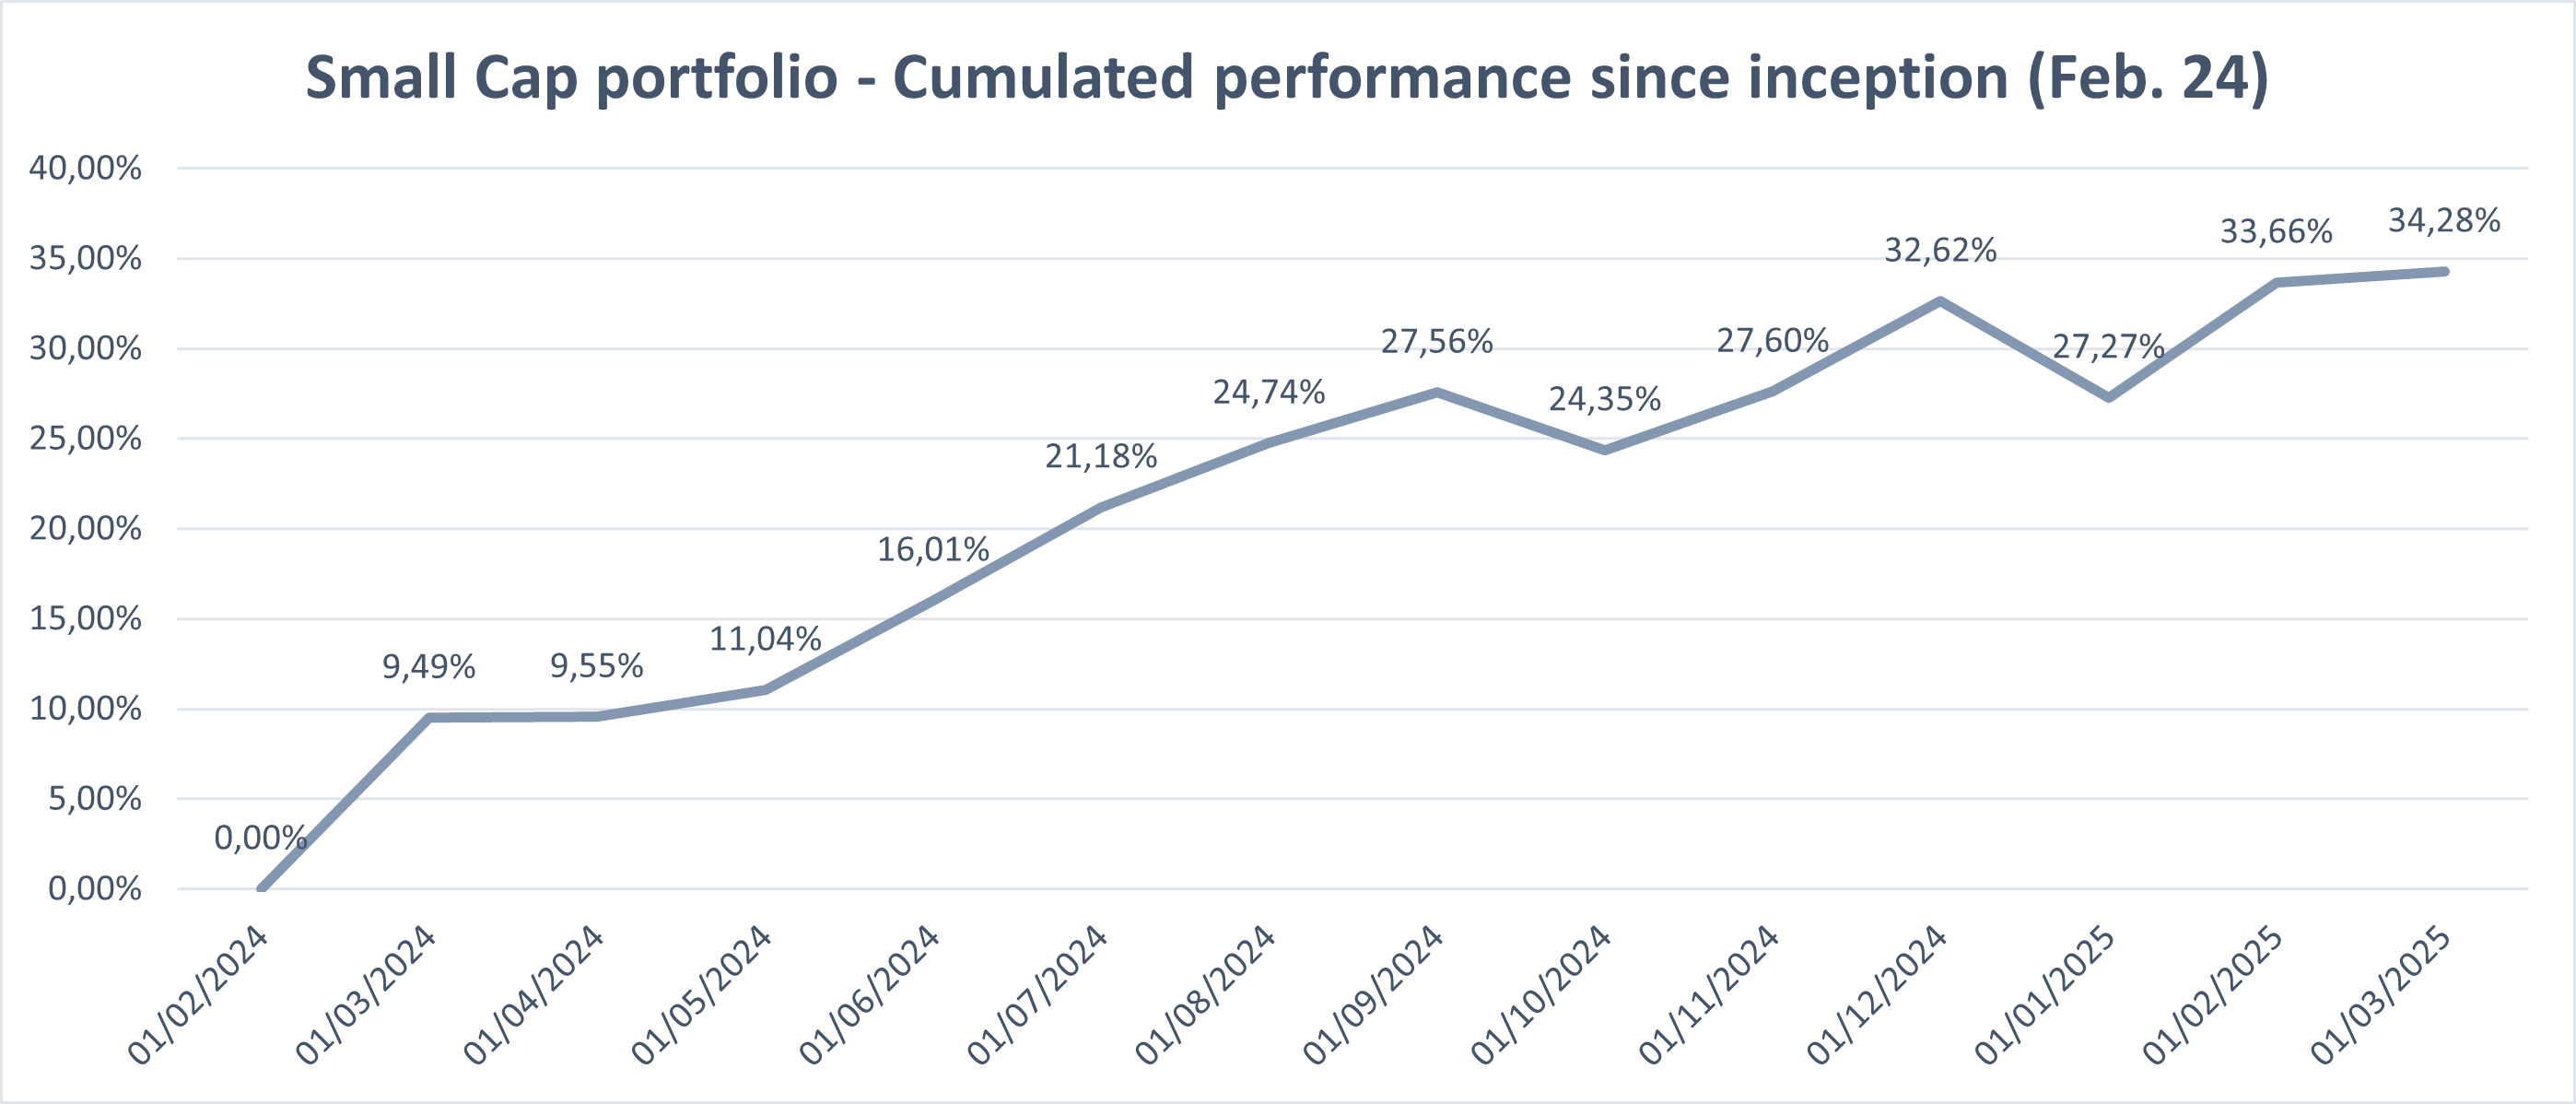
Another strong month for my small-cap portfolio, outperforming the S&P 500 by more than 2%, bringing the total outperformance to 4% in 2025 and 11% since inception a year ago.
My picks are made with the long term in mind, but it is always satisfying to see most bets paying off. There is, of course, an element of luck, but I remain committed to my selection method and money management strategy.
Valuation and metrics

My portfolio’s key metrics continued to evolve this month (weighted average)
Past growth: 18.8% —> 20.3% / Estimated future growth: 12.8% —> 13.5%
Estimated EPS growth: 15.6% —> 15.7%
Net profit margin: 28.5% —> 29.3%
ROE: 40.1% —> 40.9% / ROIC: 24.0% —> 25.4%
Debt leverage: -0.69x —> -0.81x EBITDA (so increased average net cash position)
PE: 29.9x —> 29.8x / PE Y+2: 21.5x —> 21.6x
FCF yield: 3.92% —> 3.79% / FCF yield Y+2: 5.84% —> 5.78%
Dividend yield: 1.13% —> 1.18%
Dividend growth: 8.8% —> 8.8%
Buybacks: 0.73% —> 0.69%
Expected TSR: 13.5% —> 13.8%
The impact of the stocks I sold is clearly visible.
Published articles in January
I have revamped the newsletter at the beginning of the year for a clearer, more structured format. You can now explore new categories right on my homepage.

Here are the different articles I have published:
Stock market news
Research and analysis
Stock spotlights
New stock ideas
Portfolio
The next sections (Portfolios, Stocks, News, and Moves) are exclusive to paid subscribers. While this newsletter provides valuable content for free subscribers, becoming a paid subscriber unlocks even greater benefits to help you gain an edge in the market. It is also the only way to access my small-cap portfolio.

Keep reading with a 7-day free trial
Subscribe to Quality Stocks to keep reading this post and get 7 days of free access to the full post archives.