


Monthly Portfolio Update - November 2024
Good performance for both portfolios

Hello fellow investor,
In this section, I present a transparent monthly update of my portfolio. It adheres to my investment strategy, which you can find here, and to my 8-step investment method, which you can find here.
This presentation is divided into several parts:
Global view of the portfolio’s valuation and metrics
For dividend enthusiasts, a presentation of the Projected Annual Dividend Income (PADI) and a monthly calendar
Sector and geographical breakdown
For paid subscribers, there is also:
An explanation of the month's movements
A review of the month's news
A presentation of current portfolios (small-cap and large-cap)
My reinforcement price for potential stock purchases
My fair price estimation
And, of course, access to all my content, including stock deep dives, industry analyses, screeners and scoring, and real-time updates on my buy/sell movements
Please note that my portfolio is denominated in euros, making it subject to exchange rate fluctuations, particularly the euro-dollar exchange rate.
Overall performance

My performance this month has been satisfying, particularly with how I managed the downturn in ASML and compared to the poor performance of the whole market. Selling stocks over recent months proved beneficial (luxury, …), allowing me to “cut the weeds and water the flowers”.
I still have some cash on hand, as I find the market generally overvalued. Most of my new investments are directed towards my small-cap portfolios, where I see the most promising opportunities.

The small-cap portfolio has reached an all-time high. While some stocks are beginning to look pricey, others still have significant growth potential and show strong business momentum. Nonetheless, I won’t hesitate to sell if any issues arise.
Valuation and metrics
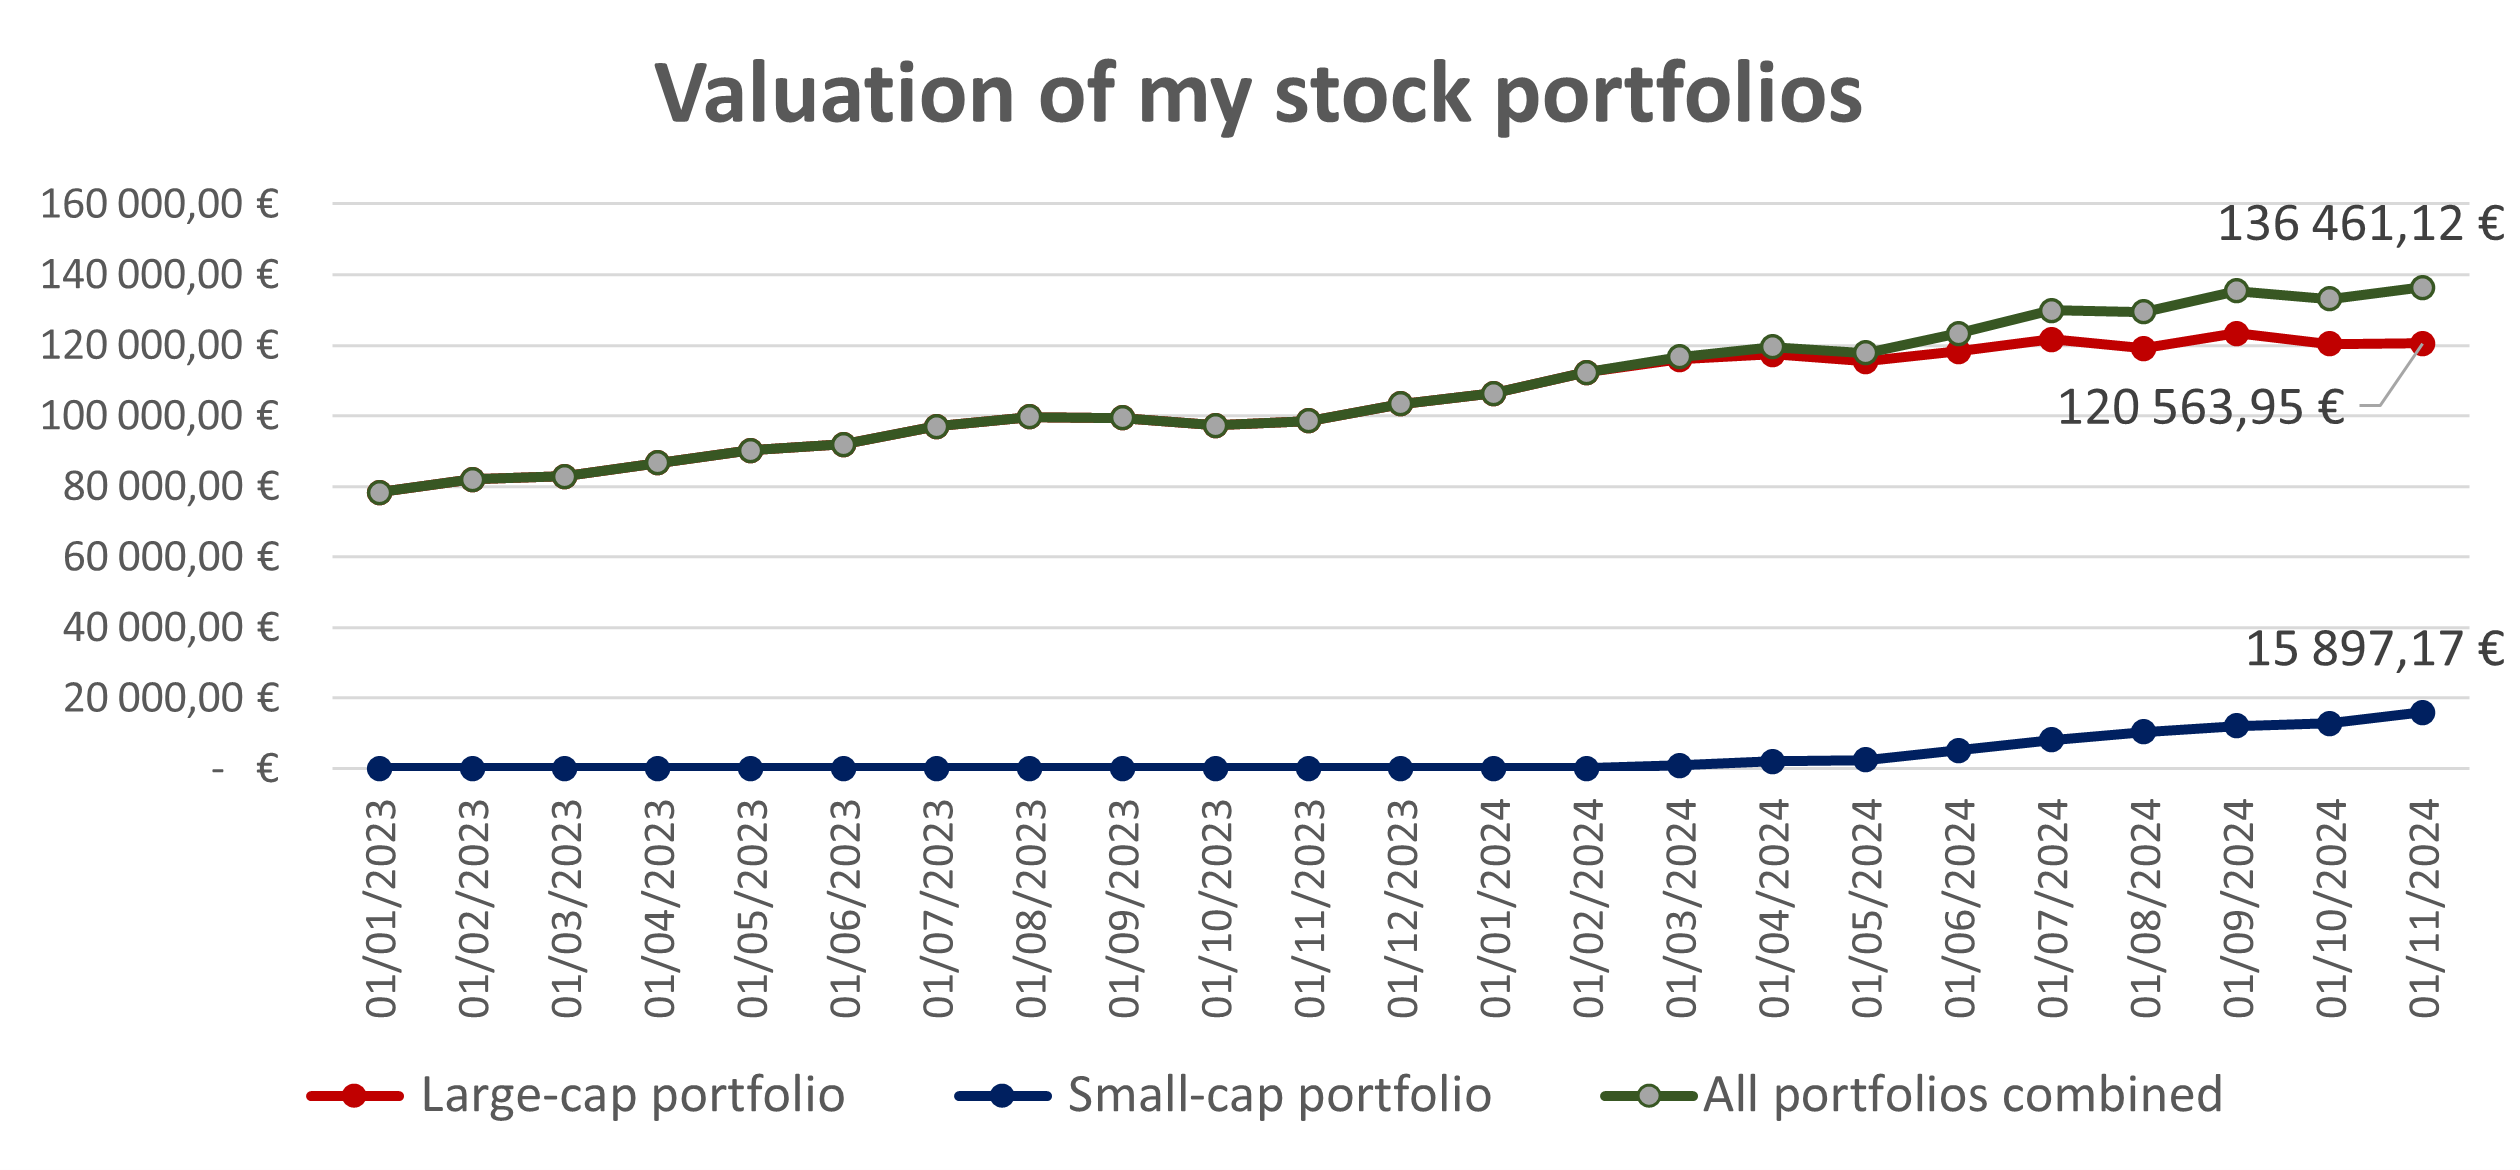
This month I added 2k€ in my small-cap portfolio.
My portfolio’s key metrics continued to evolve this month (weighted average)
Past growth: 17.3% —> 17.9% / Estimated future growth: 12.1% —> 12.4%
Net profit margin: 28.8% —> 28.8%
ROE: 42.6% —> 41.7% / ROIC: 26.4% —> 25.7%
Debt leverage: -0.39x —> -0.47x EBITDA (so average net cash position)
PE: 29.1x —> 28.9x / PE Y+2: 21.0x —> 20.7x
FCF yield: 4.06—> 4.06% / FCF yield Y+2: 5.75% —> 6.00%
Dividend yield: 1.29% —> 1.26%
Dividend growth: 9.9% —> 9.5%
Buybacks: 0.77% —> 0.73%
Expected TSR: 13.1% —> 13.5%
Focusing solely on my small-cap portfolio, here are the key metrics (weighted average):
Past growth: 23.2% —> 23.8% / Estimated future growth: 16.7% —> 17.8%
Net profit margin: 22.7% —> 22.6%
ROE: 39.6% —> 37.9% / ROIC: 30.1% —> 27.6%
Debt leverage: -0.70x —> -0.54 EBITDA (so average net cash position)
PE: 23.1x —> 25.0x / PE Y+2: 16.5x —> 16.4x
FCF yield: 5.4% —> 5.3% / FCF yield Y+2: 8.8% —> 9.6%
Dividend yield: 2.2% —> 1.89%
Dividend growth: 11.8% —> 10.4%
Dilution: -0.1% —> -0.08%
Expected TSR: 17.4% —> 18.0%
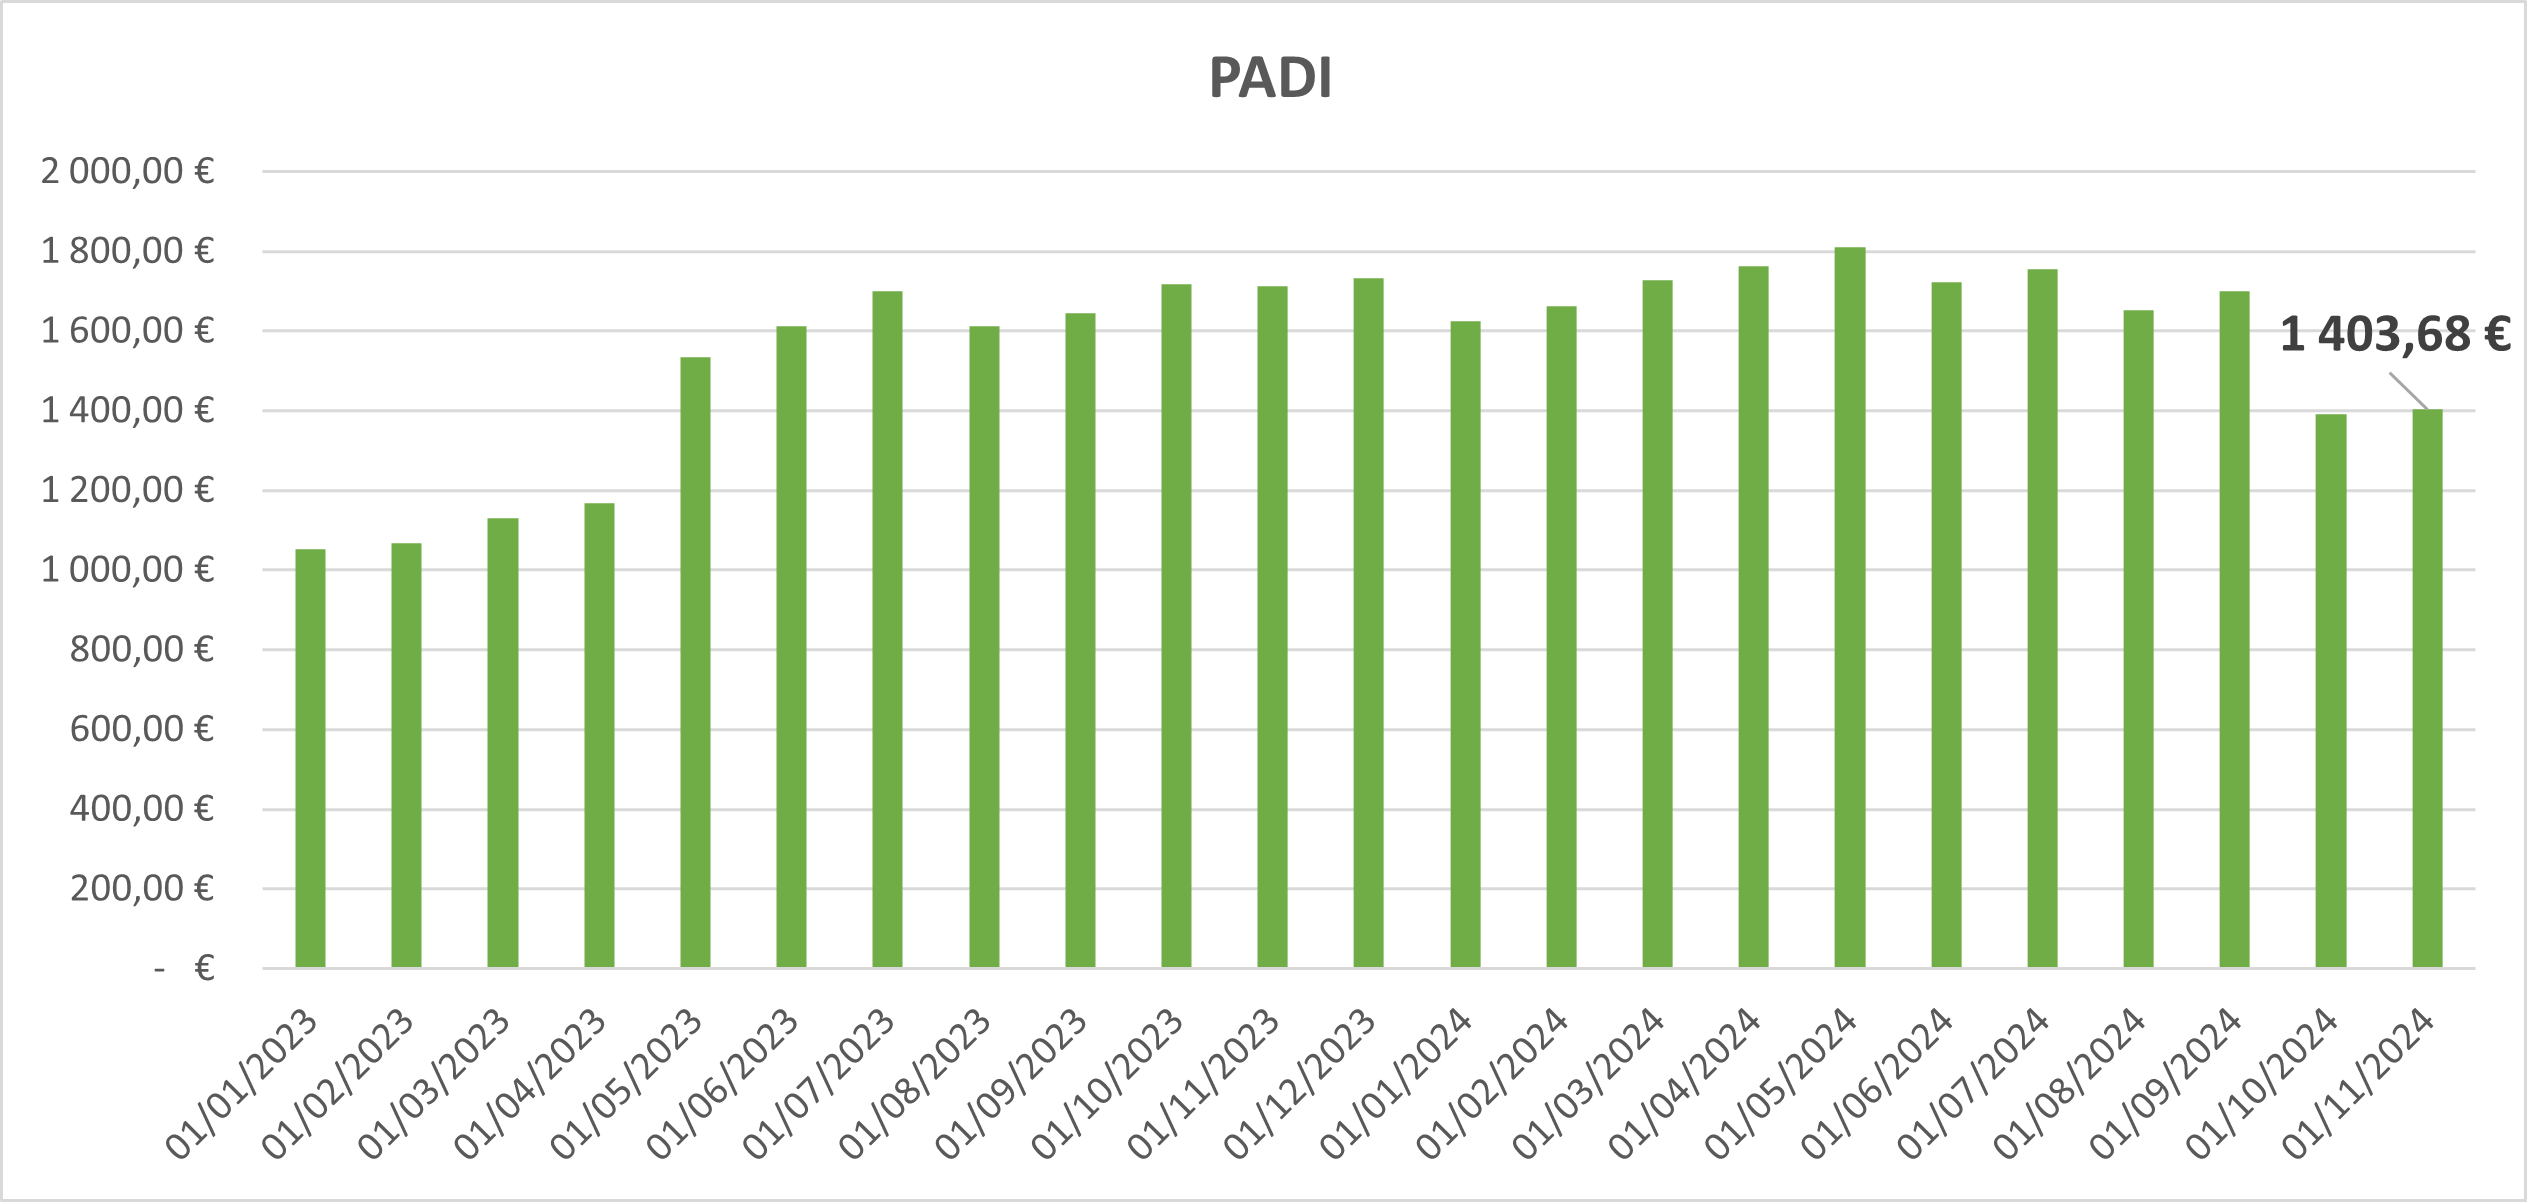
PADI remains relatively stable.
Published articles in October
Stock deep dives
Industry analysis
One Pagers
Stock duel
Stock market news and culture
Series
Screeners
Stock picking
Before seeing the 2 portfolios (stocks, moves, news), subscribe now to gain full access to this section. Unlock exclusive access to all my content, including in-depth stock analyses, screening tools, industry reports, and valuable portfolio insights!
Keep reading with a 7-day free trial
Subscribe to Quality Stocks to keep reading this post and get 7 days of free access to the full post archives.