


Monthly Portfolio Update - February 2025
A strong start to the year, with a clear outperformance compared to the Nasdaq and S&P 500

Following a strong 2024, 2025 is off to a great start! My small-cap portfolio is up 5.02%, and my large-cap portfolio has gained 4.57%, outperforming the S&P 500's 2.70% and the Nasdaq's 2.22%.
If you are curious or missed out, you can find my method here and how to react in case anything bad happens here.
In this section, I present a transparent monthly update of my portfolio. It adheres to my investment strategy. This presentation is divided into several parts:
Global view of the portfolio’s valuation and metrics
For dividend enthusiasts, a presentation of the Projected Annual Dividend Income (PADI) and a monthly calendar
Sector and geographical breakdown
My positions, fair price, price targets and moves
Overall performance
Large-cap portfolio

My large-cap portfolio hit an all-time high this month with a 4.5% gain. Two key advantages stood out: a diversified approach that kept volatility in check and strong earnings from major holdings. On the brutal trading day (when Nvidia plunged nearly 17% and the Nasdaq dropped 3%) my portfolio dipped just 0.2%. This reinforces a crucial lesson: deep understanding of business models and competitive advantages provides a real edge in the market.
Small-cap portfolio
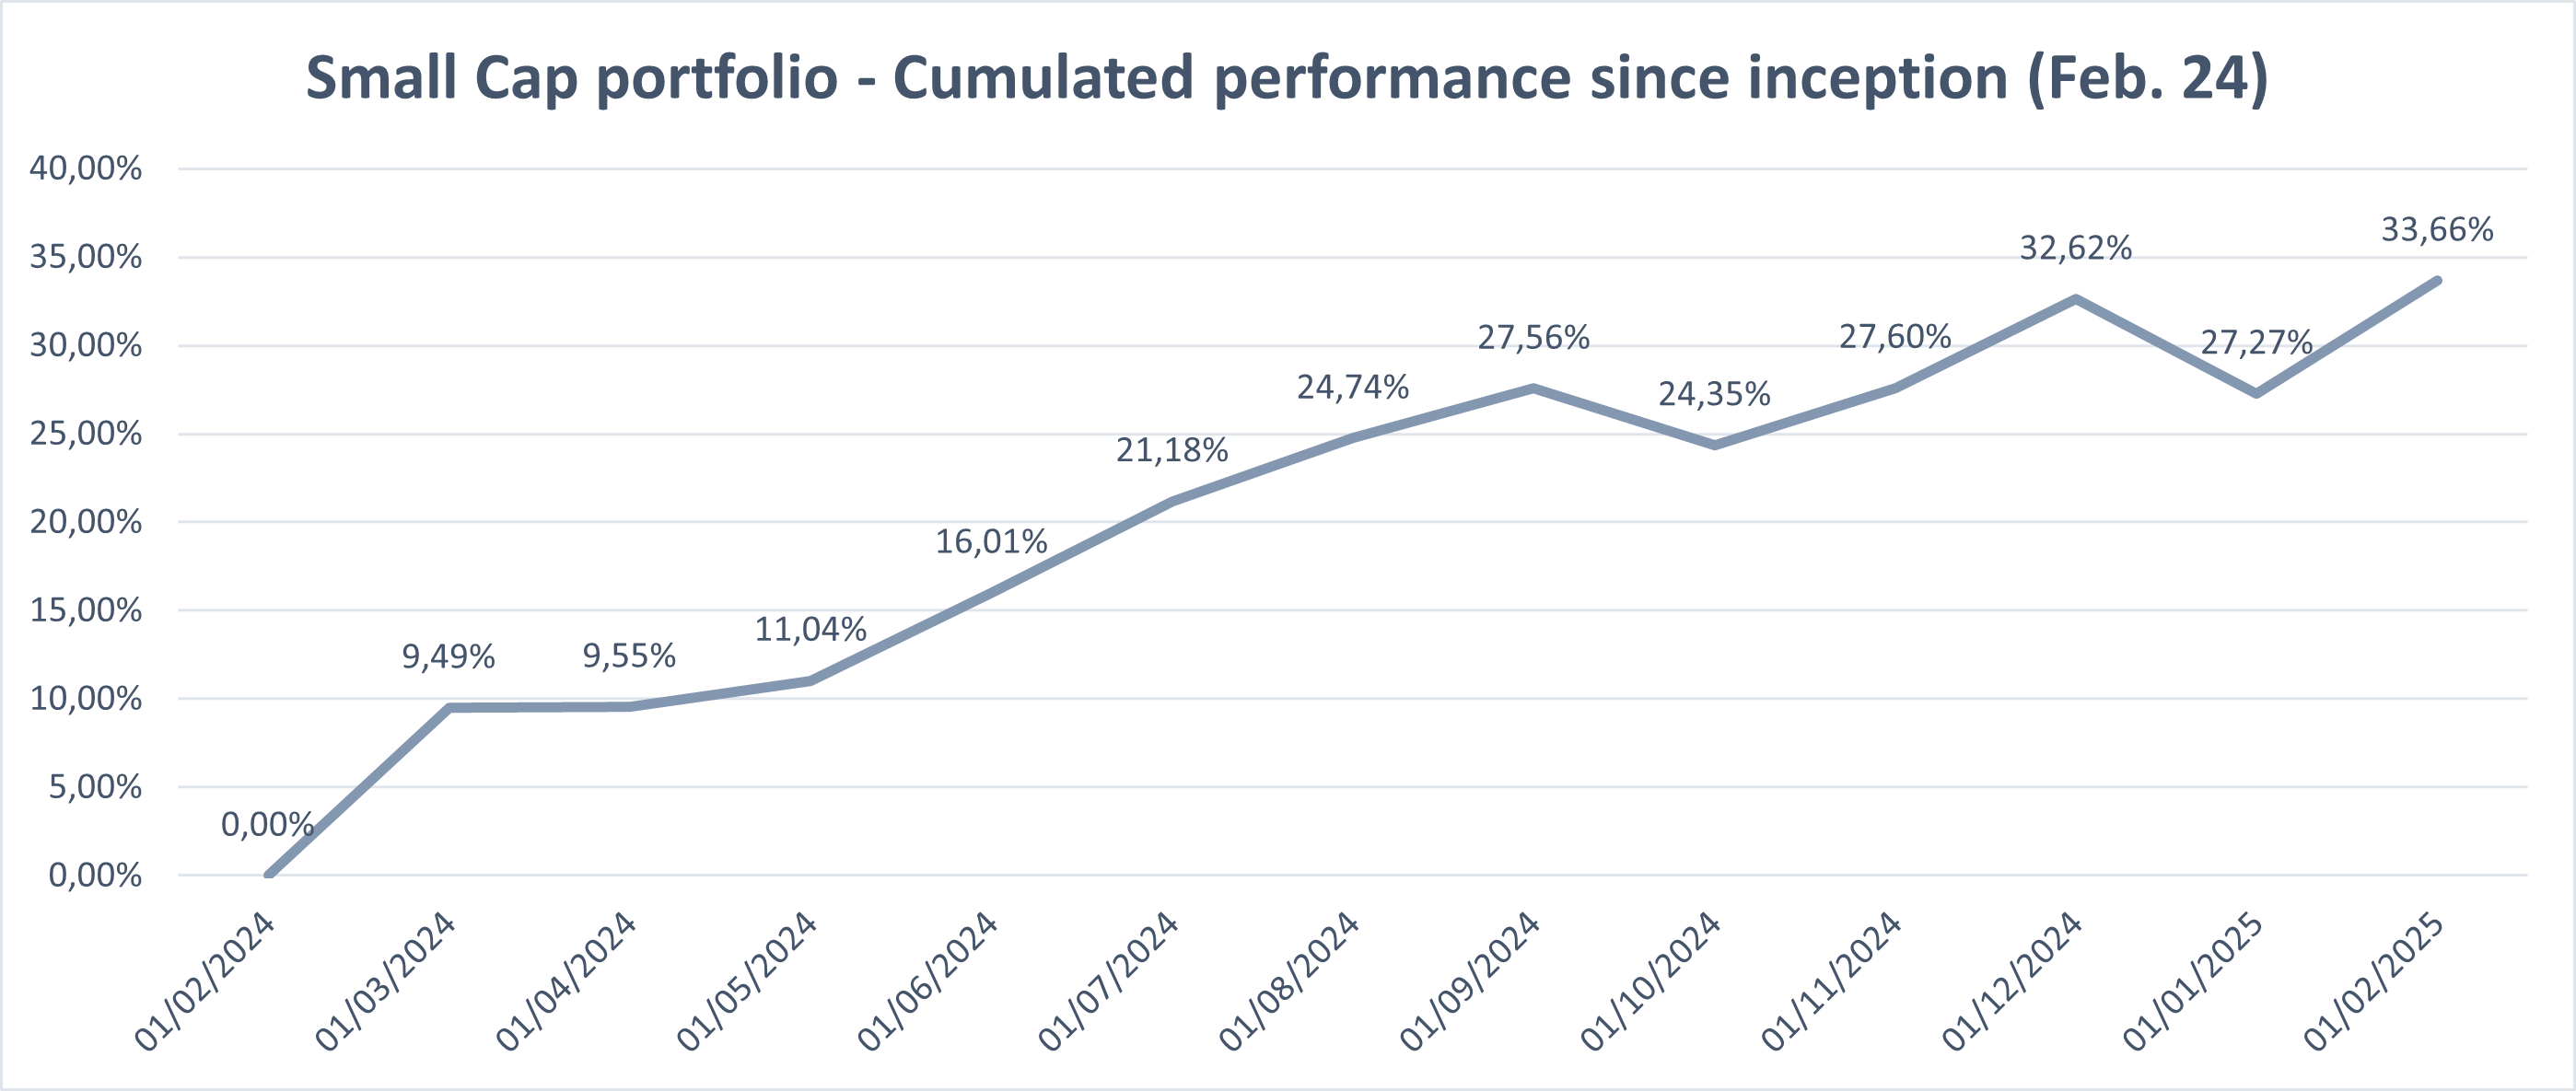
After delivering a 27% return in 2024 (despite starting only at the end of February) my small-cap portfolio is already up 5% in January. I also made a strategic move, selling one stock from the portfolio. If you are curious, I reviewed my whole portfolio to reassess my investment theses and the potential of each stock. Now, I am now ready for 2025.
Valuation and metrics

My portfolio’s key metrics continued to evolve this month (weighted average)
Past growth: 18.4% —> 18.8% / Estimated future growth: 13.1% —> 12.8%
Estimated EPS growth: 16.0% —> 15.6%
Net profit margin: 28.5% —> 28.5%
ROE: 40.6% —> 40.1% / ROIC: 24.4% —> 24.0%
Debt leverage: -0.64x —> -0.69x EBITDA (so average net cash position)
PE: 29.9x —> 29.9x / PE Y+2: 21.5x —> 21.5x
FCF yield: 3.97% —> 3.92% / FCF yield Y+2: 5.89% —> 5.84%
Dividend yield: 1.19% —> 1.13%
Dividend growth: 8.7% —> 8.8%
Buybacks: 0.69% —> 0.73%
Expected TSR: 13.5% —> 13.5%
Key metrics remain very strong, reflecting my commitment to quality.
Published articles in January
I have revamped the newsletter at the beginning of the year for a clearer, more structured format. You can now explore new categories right on my homepage.
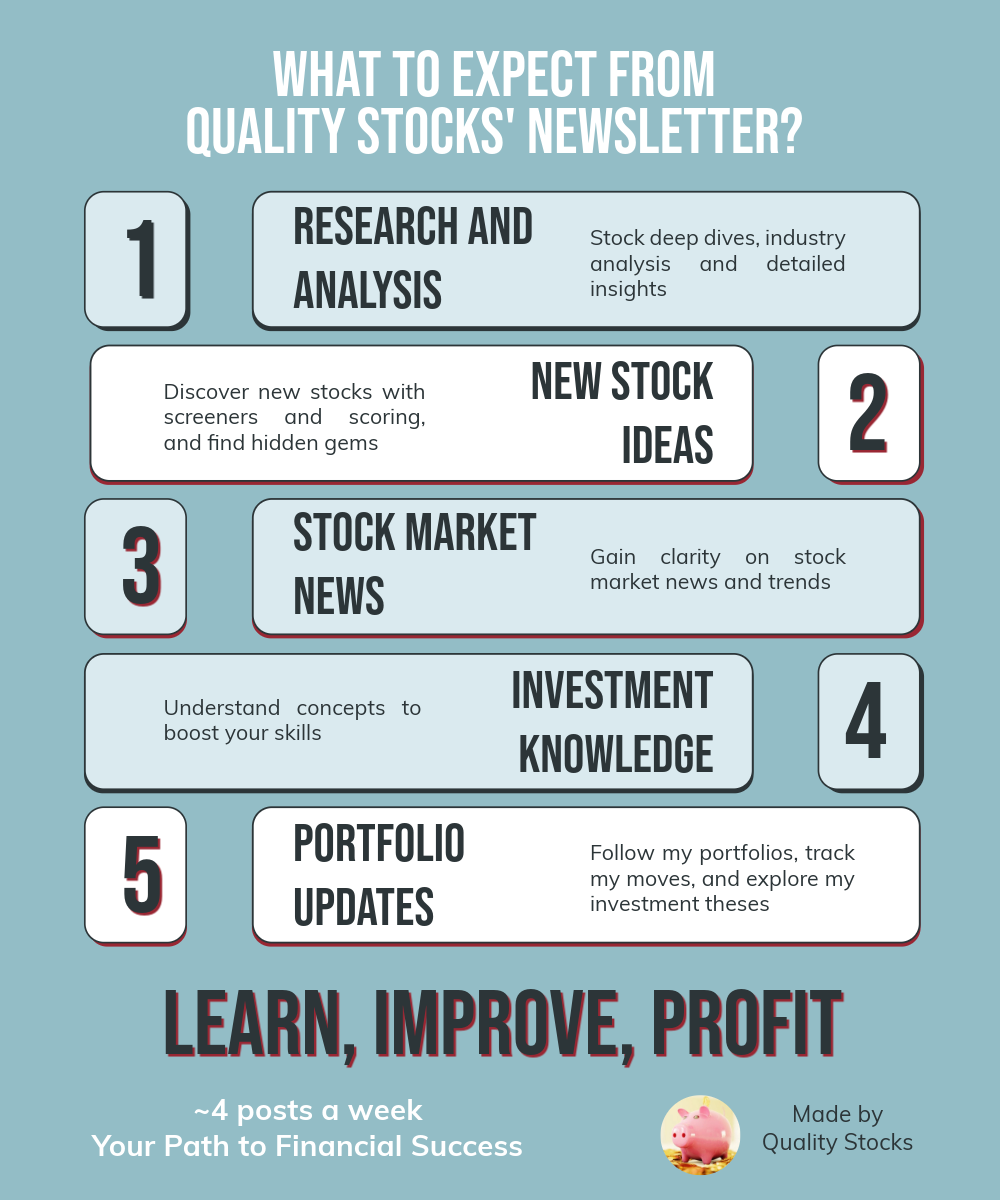
Here are the different articles I have published:
Stock market news
Research and analysis
Investment knowledge
Stock spotlights
New stock ideas
My portfolio
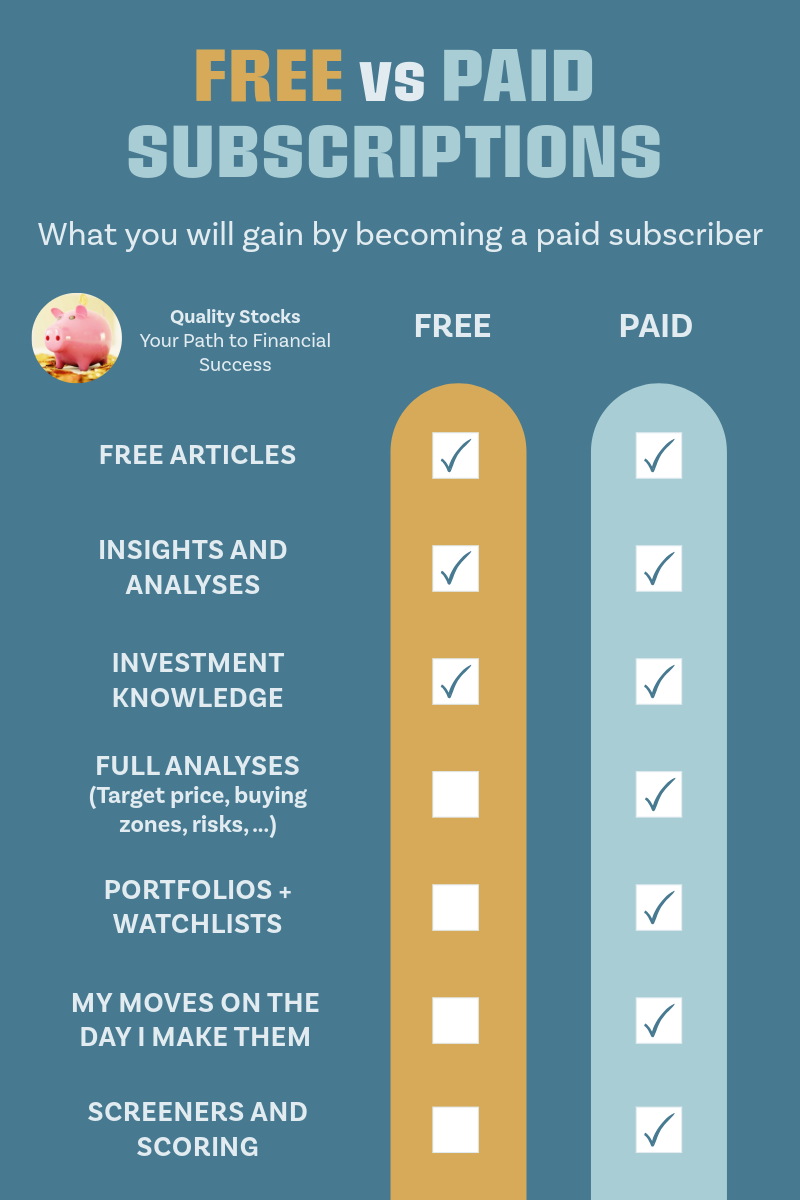
The next sections (Portfolios, Stocks, News, and Moves) are exclusive to paid subscribers. While this newsletter provides valuable content for free subscribers, becoming a paid subscriber unlocks even greater benefits to help you gain an edge in the market.
Here is why upgrading to a paid subscription is worth it:
Access exclusive content. Dive deeper with detailed analyses, advanced insights, and premium research not available to free subscribers
Follow my portfolio. Gain exclusive access to my portfolio, including monthly updates, tracking my moves, and watchlists
Discover more stock ideas. Explore in-depth stock ideas, technical analyses, and strategies tailored to uncover hidden opportunities
Support this newsletter. Your subscription directly supports the creation of high-quality, valuable content to help you achieve your investment goals
Upgrade today and take your investing knowledge and performance to the next level!
Keep reading with a 7-day free trial
Subscribe to Quality Stocks to keep reading this post and get 7 days of free access to the full post archives.