

Monthly Portfolio Update - September 2024 + Key Movements
Monthly Portfolio Update - September 2024 + Key Movements
This month has been a rollercoaster, but overall, the performance has been positive

Hello fellow investor,
In this section, I present a transparent monthly update of my portfolio. It adheres to my investment strategy, which you can find here. Additionally, I have detailed my approach to Total Shareholder Return (TSR) in this article.
This presentation is divided into several parts:
Global view of the portfolio’s valuation and metrics
For dividend enthusiasts, a presentation of the Projected Annual Dividend Income (PADI) and a monthly calendar
Sector and geographical breakdown
For paid subscribers, there is also:
An explanation of the month's movements
A review of the month's news
A presentation of current portfolios (small-cap and large-cap)
My reinforcement price for potential stock purchases
My fair price estimation
And, of course, access to all my content, including stock deep dives, industry analyses, screeners and scoring, and real-time updates on my buy/sell movements
Please note that my portfolio is denominated in euros, making it subject to exchange rate fluctuations, particularly the euro-dollar exchange rate.
Overall performance
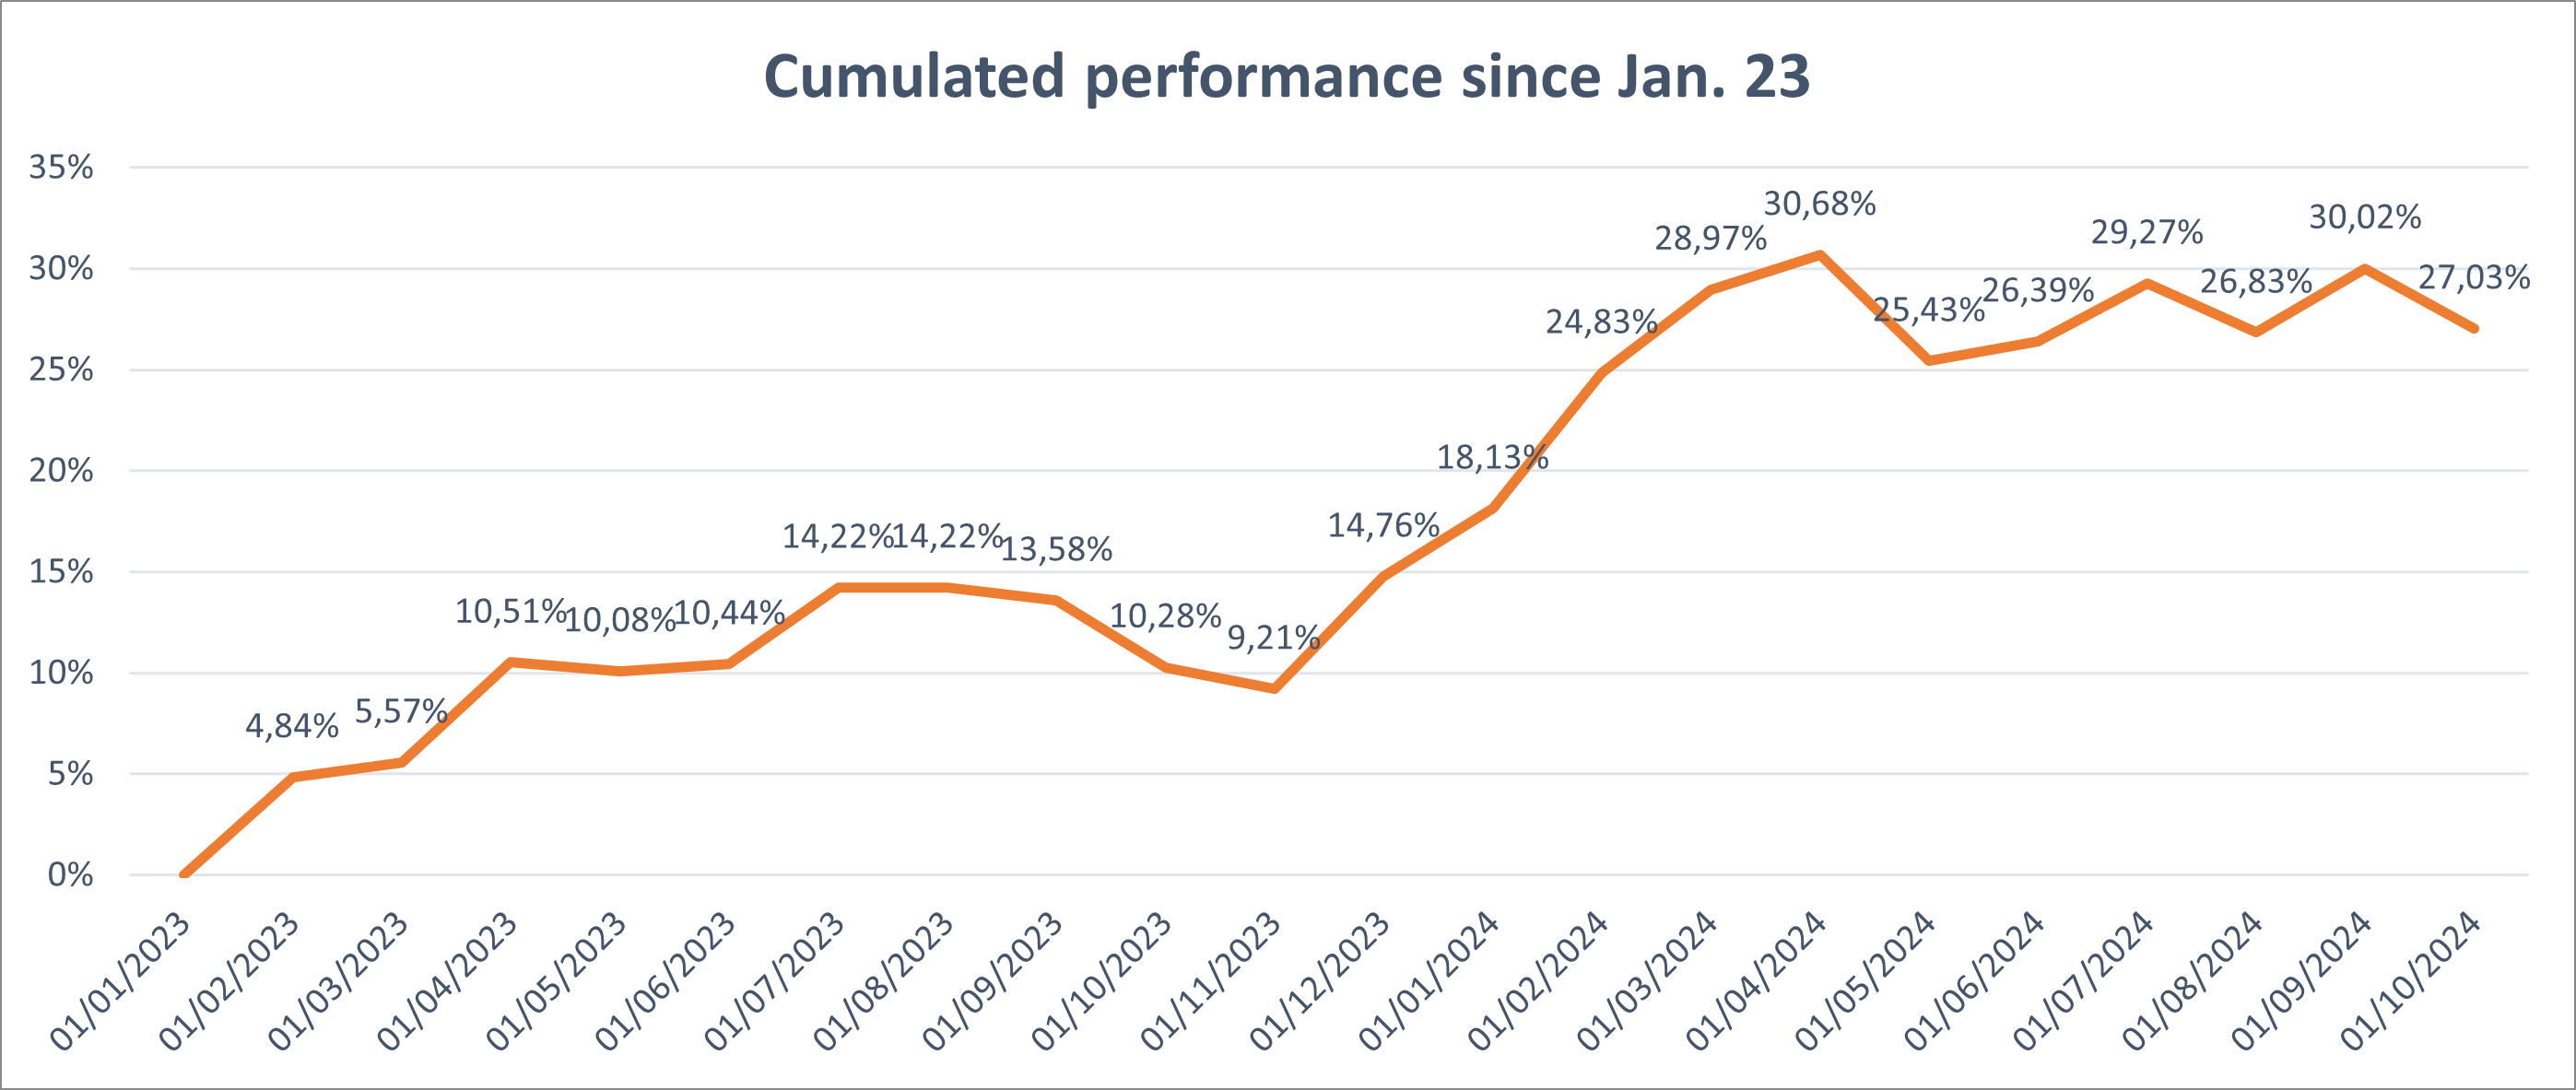
Decent performance. The US stocks are clearly overperforming the European stocks.
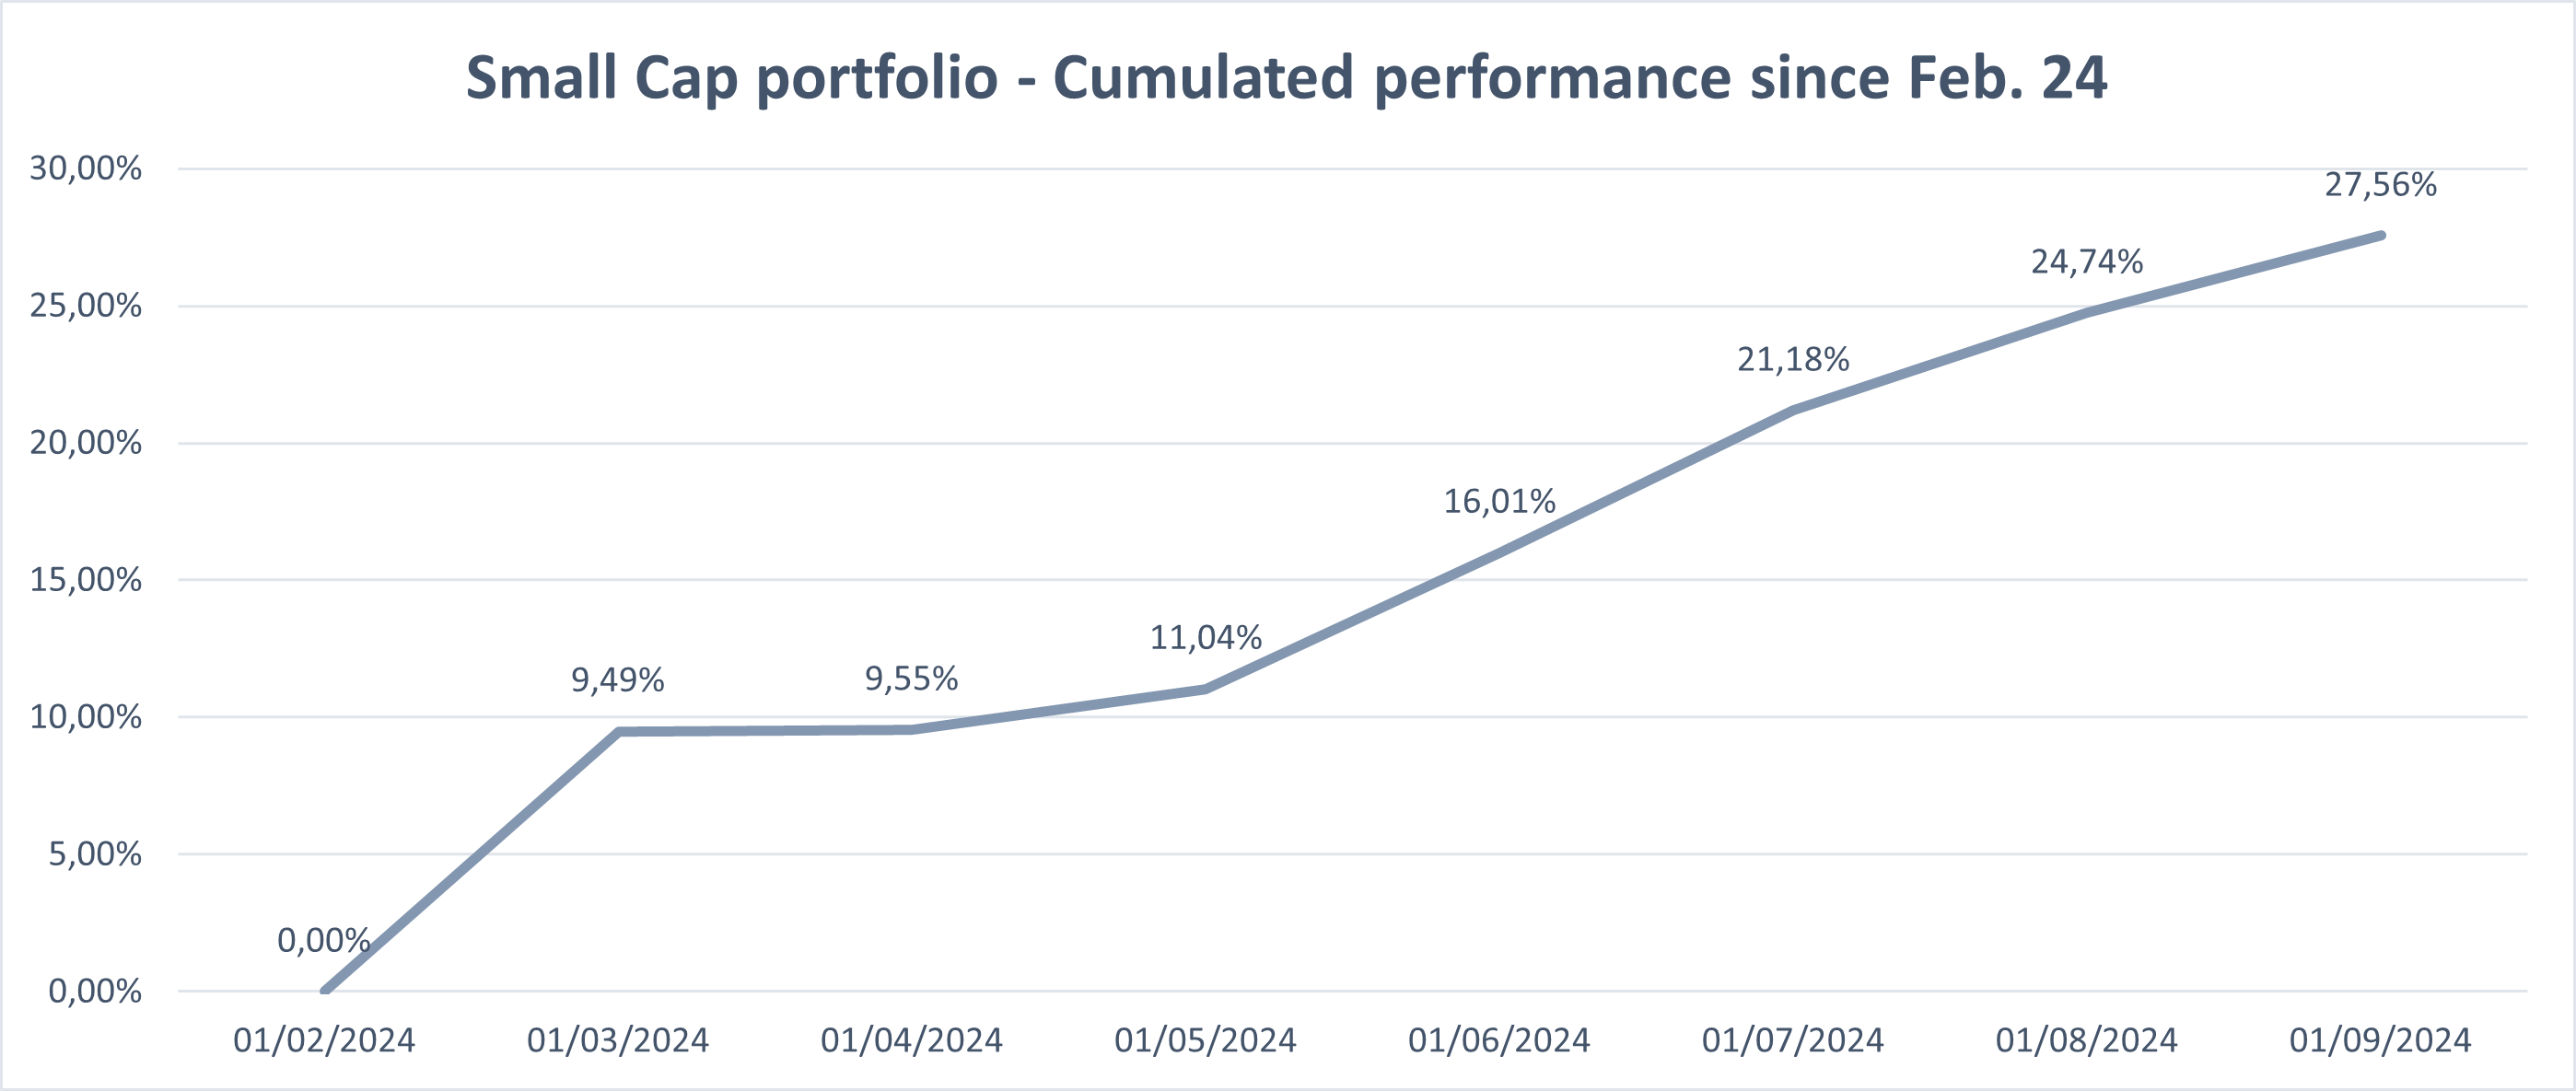
The small-cap portfolio alone continues to have a strong performance. For now, every month has seen a positive performance - this won’t last of course.
I took advantage of the price drop at the beginning of the month to reinforce some positions. However, the recovery was quick. I remain cautious and ready to buy in case of a potential bear market following my plan as I described in these 2 articles: Do's and Don'ts in a Bear Market and Watchlist and Price Target in Case of a Potential Market Consolidation.
Valuation and metrics
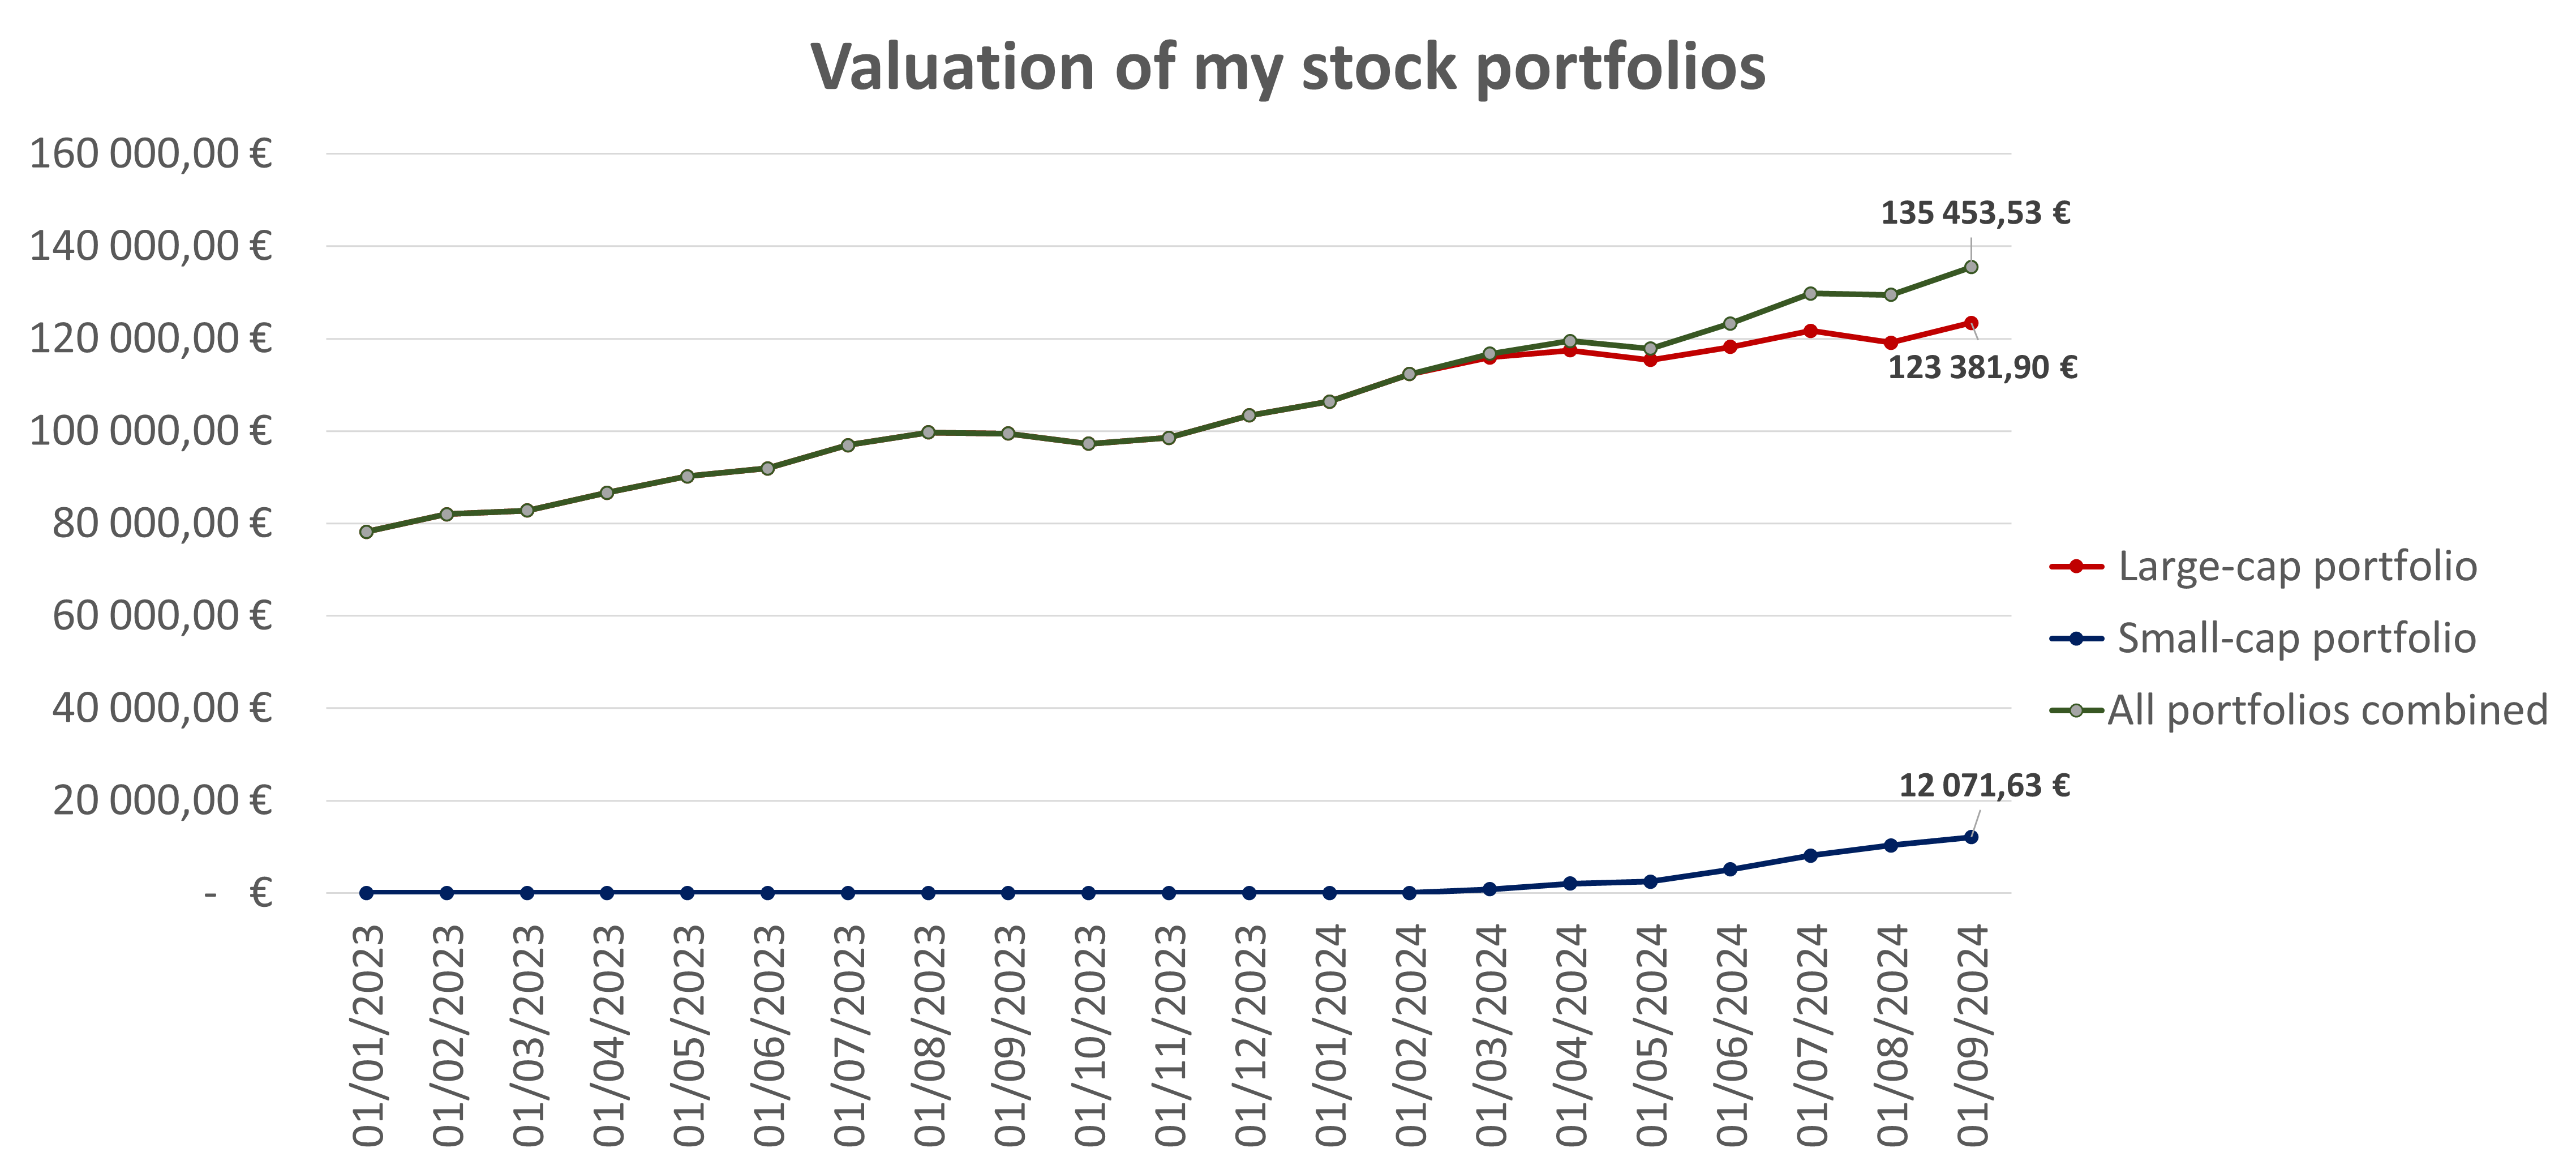
This month I added 3k€ in total, 1.5k€ for my small-cap portfolio and 1.5k€ for my large-cap portfolio.
My portfolio’s key metrics are:
Past growth: 15.6% / Estimated future growth: 11.2%
Net profit margin: 26.4%
ROE: 40.5% / ROIC: 24.8%
Debt leverage: -0.28x EBITDA (so average net cash position)
PE: 29.2x / PE Y+2: 21.4x
FCF yield: 4.08% / FCF yield Y+2: 5.64%
Dividend yield: 1.33%
Dividend growth: 9.9%
Buybacks: 0.72%
Expected TSR: 12.6%
Focusing solely on my small-cap portfolio, here are the key metrics (weighted average):
Past growth: 21.7% / Estimated future growth: 16.5%
Net profit margin: 23.2%
ROE: 41.3% / ROIC: 31.0%
Debt leverage: -0.6x EBITDA (so average net cash position)
PE: 22.6x / PE Y+2: 15.9x
FCF yield: 5.7% / FCF yield Y+2: 9.0%
Dividend yield: 2.2%
Dividend growth: 12.7%
Dilution: -0.1%
Expected TSR: 17.3%
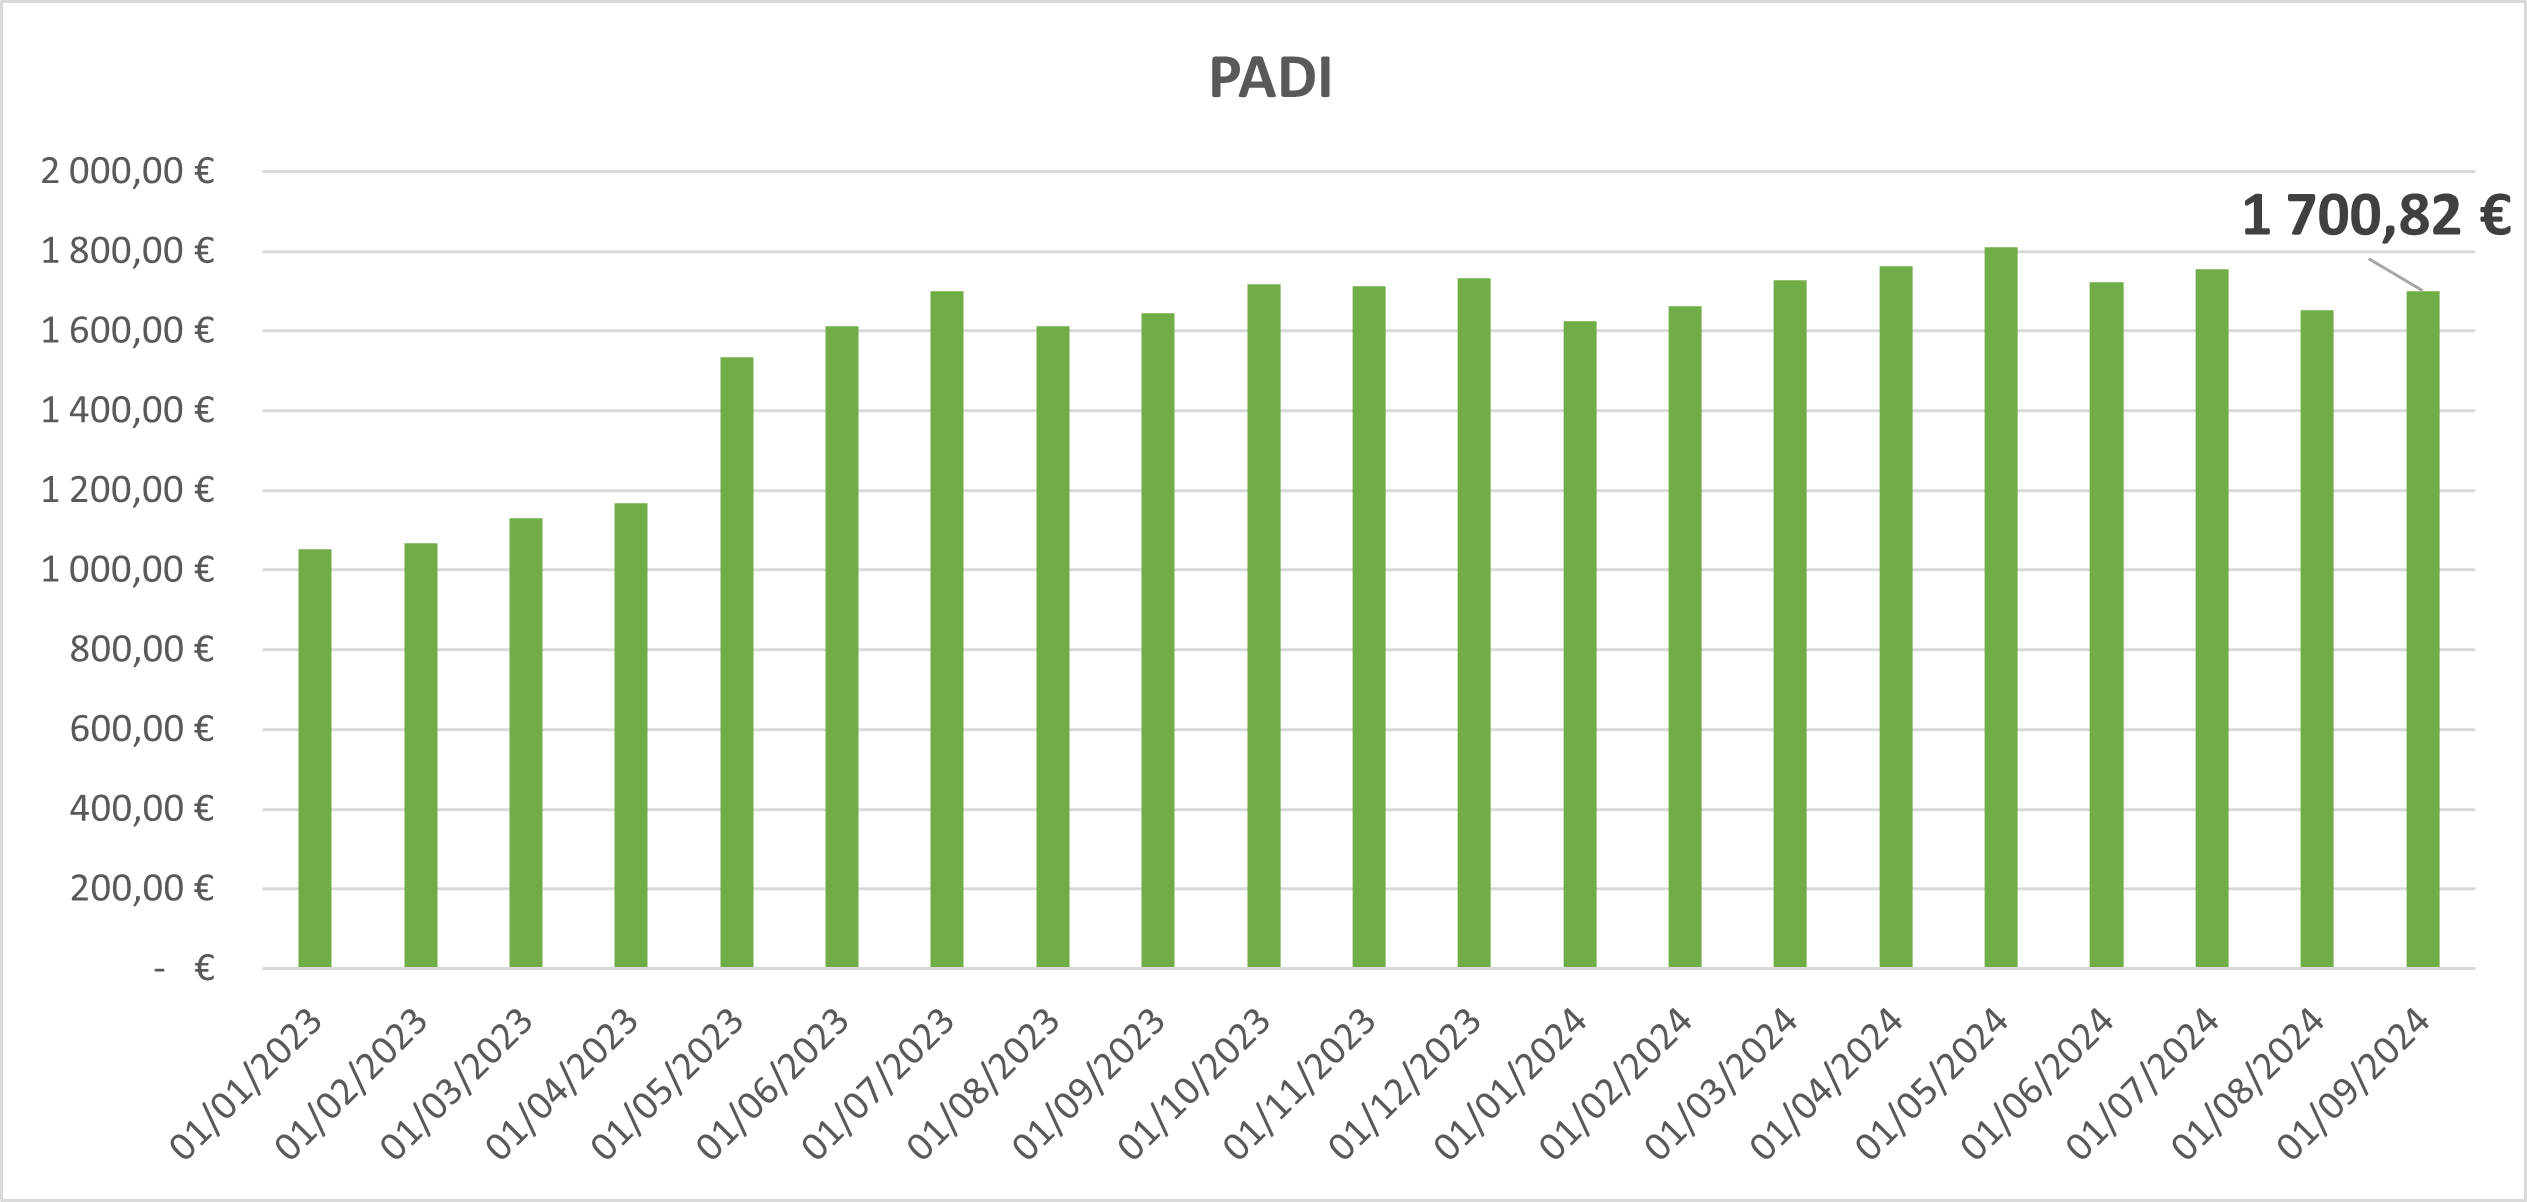
PADI increased slightly and remain stable. The focus on growth in my portfolio rotation explains this.
Published articles in July
Stock deep dives
Stock market news and culture
One Pager Thursdays
Stock duels
Screeners
Stock picking
And now it is time to discover the 2 portfolios (stocks and news)
Keep reading with a 7-day free trial
Subscribe to Quality Stocks to keep reading this post and get 7 days of free access to the full post archives.