Valuation Ratios and the Overlooked Role of Margin Evolution
Understanding margin evolution can explain valuation
Valuation ratios are often linked to revenue growth, but this isn’t the only factor driving valuations. Since multiple elements, including market sentiment, influence valuation, investors can sometimes find it challenging to make sense of certain valuations.
In this article, we will focus on one key driver: net profit margin evolution. Using actual data, we will analyze how shifts in profit margins affect valuation across various industries. While this analysis doesn’t claim a perfect or immediate correlation between the two, it aims to demonstrate the significant role margin trends can play, helping investors refine their understanding and investment strategies.
Methodology
In this analysis, I compare the 2024 projected PE with the evolution of net profit margins. The margin evolution is calculated by comparing the average net margin from 2019-2023 to the projected average margin for 2024-2026. In some cases, I adjusted the data to account for exceptional events that could distort the PE, such as major acquisitions or write-downs, but I minimized these interventions wherever possible to preserve the integrity of the analysis.
For example, in the case of Costco, the average net margin between 2019 and 2023 was 2.61%, while the projected margin for 2024-2026 is 2.97%. This represents an increase of 14.0% (calculated as 2.97 / 2.61).
We will explore six sectors, analyzing 55 stocks as examples. These sectors are:
European Software
Animal and Pet Care
Payments
Retail
Luxury
Semiconductors
European Software
13 stocks were used for this analysis: Qt Group, Atoss, Fortnox, Smartcraft, Dassault Systemes, Equasens, Cbrain, Shoper, Truecaller, Cerillion, Rightmove, Nexus and Text.
Example of stocks with low margin increase and low PE: Equasens, Text and Rightmove.
Example of stocks with high margin increase and high PE: Qt Group or CBrain.
Animal and Pet Care
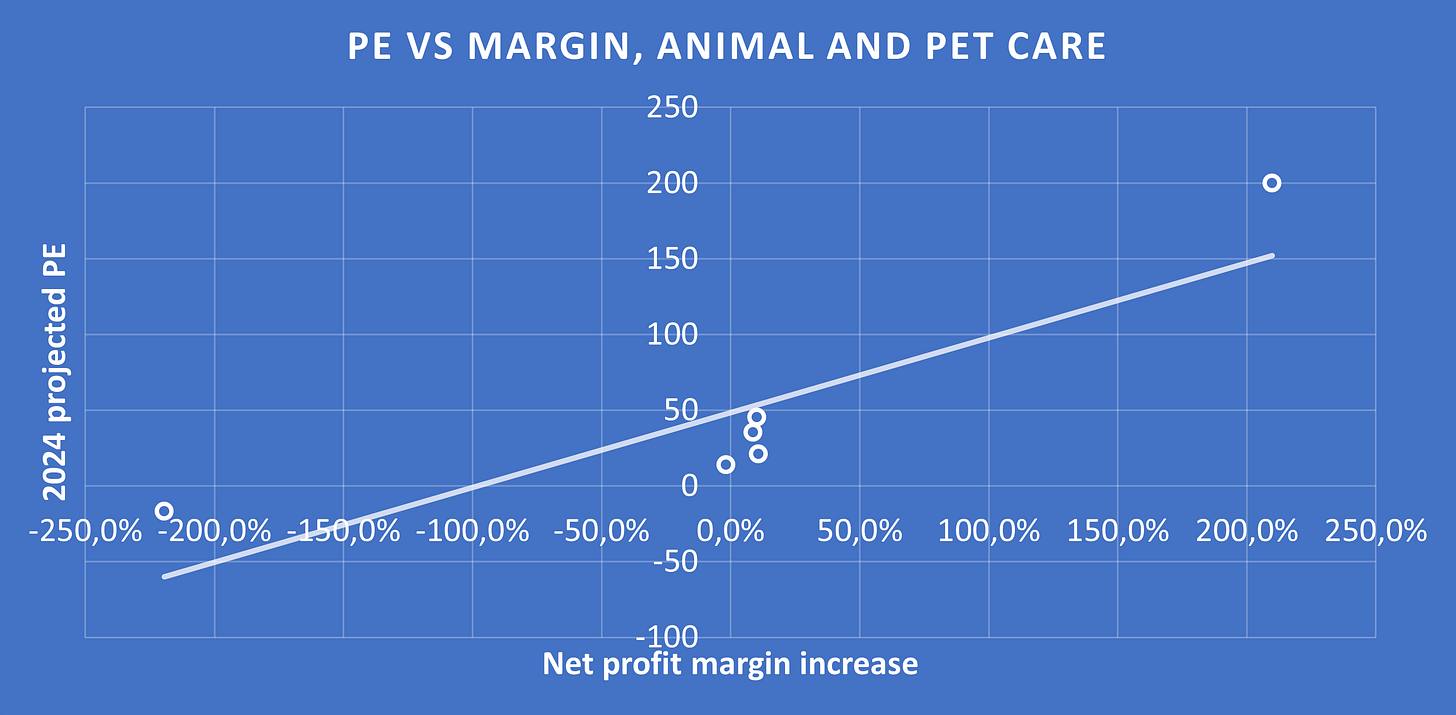
6 stocks were used for this analysis: Zoetis, Idexx, Elanco, Freshpet, Virbac and Petco.
Although Petco and Freshpet create outliers, making the trend harder to spot, the pattern is clearly observable in the other four stocks.
Payments
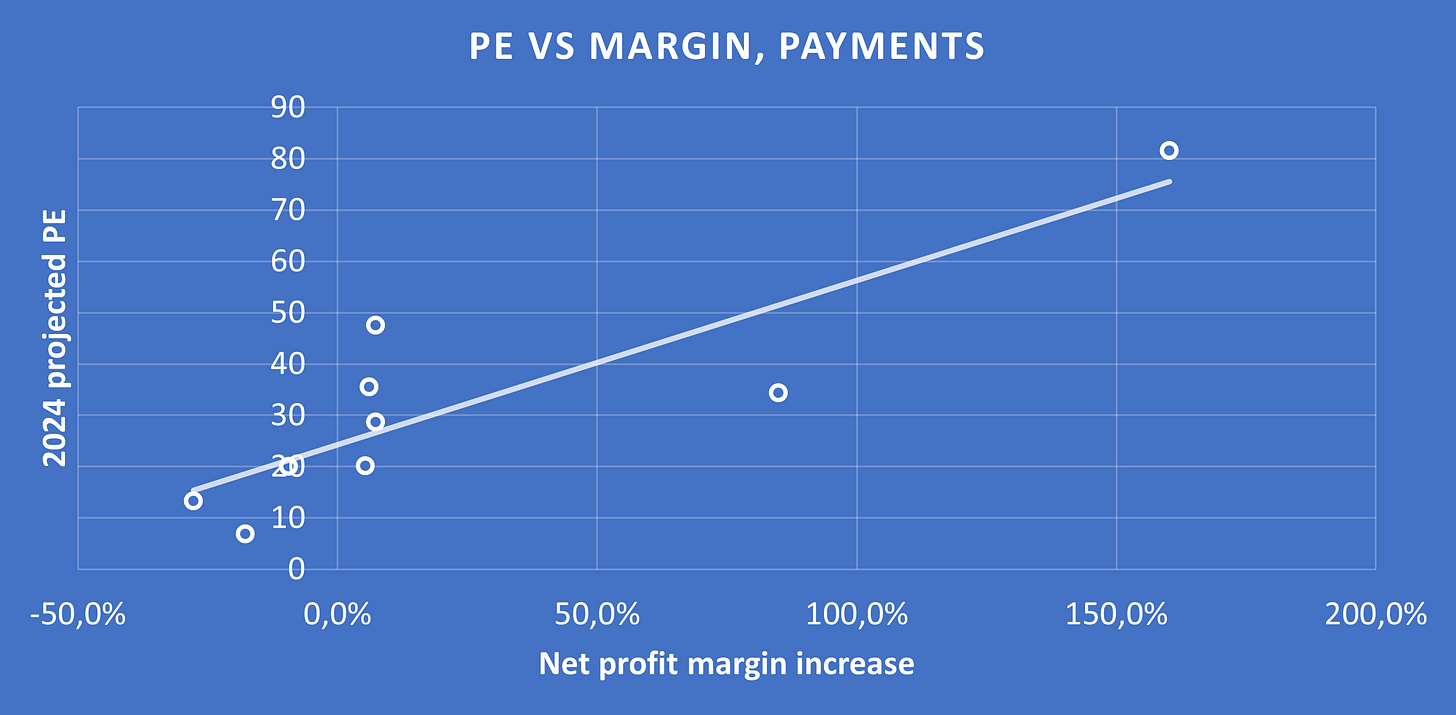
8 stocks were used for this analysis: Shift4 Payments, Visa, Mastercard, Worldline, Adyen, American Express, Paypal, Western Union.
Shift4 Payments has the highest margin increase and a correspondingly high PE ratio. In contrast, Western Union and Worldline are currently facing declines in both net profit margins and revenues, which explains their significantly lower PE ratios.
Retail
9 stocks were used for this analysis: Costco, Carrefour, Alimentation Couche-Tard, Target, Walmart, Dollar Tree, Dollar General, Dollarama and The TJX Company.
Luxury
7 stocks were used for this analysis: LVMH, Kering, Hermes, Ferrari, Brunello Cucinelli, Hugo Boss and Ermenegildo Zegna.
Kering and Hugo Boss have the lowest PE ratios, both reflecting a decline in net profit margins between the two periods. In contrast, Hermes, Ferrari, and Brunello Cucinelli show similar PE ratios, driven by similare margin growth over the same time frame.
Semiconductors
11 stocks were used for this analysis: Applied Materials, KLA Corporation, LAM Research, Qualcomm, Broadcom, Tokyo Electron, Disco Corporation, Lasertec, ACM Research, NVidia and ASML.
Among the stocks analyzed, the correlation is strong. Nvidia stands out as the most expensive, with the highest margin increase, while ACM Research has the lowest PE ratio, reflecting a decline in margins.
Limitations of the analysis
This approach, however, is not universal. It is most applicable to relatively stable companies where profit margins are significant, as we rely on the PEs as the primary valuation metric. A PE requires a positive margin to be meaningful!
Additionally, the analysis assumes margin variations remain within a reasonable range. If margins experience a drastic decline, PE ratios can become inflated or irrelevant, limiting their predictive power. While falling margins usually signal lower valuations, this relationship becomes difficult to measure if the margin drop is extreme. This is why I have chosen industries with relatively high, stable margins to minimize distortion. In other sectors with more volatile margins, different valuation metrics would be needed.
Implications for the investor
An increase in net profit margins, while indicating better financial health for a company, can also signal various factors, such as:
Enhanced operational efficiency
Gaining market share
Improved productivity
A stronger product mix
A positive evolution in the business model
While net profit margin trends can provide insights into valuation, predicting future movements is challenging. The market often reacts strongly to signs of margin decline, making it crucial for investors to assess whether these trends are temporary. Recognizing these patterns can help investors anticipate shifts in valuation, though it is important to note that forecasting is inherently difficult and usually proves to be useless.
Moreover, a company demonstrating margin improvement may represent a compelling investment opportunity, particularly if the market has not fully acknowledged this growth.
Recent examples highlight the significance of analyzing net profit margins:
The surge in Meta's stock in 2023, driven by rising margins.
PayPal's decline, primarily due to decreasing margins that exacerbated its valuation ratio drop, despite continued revenue growth. Recently, however, the stock has been rebounding alongside signs of margin stabilization.
Conclusion
Companies that can sustain or expand margins while growing revenues often attract premium valuations. Investors reward firms that show both strong top-line growth and improving profitability, as it suggests scalability and potential for long-term success.
However, valuation adjustments are not always linear. Margins can fluctuate due to various external factors like market competition, input costs, and macroeconomic conditions. Investors must assess whether margin improvements are sustainable or temporary when determining the potential of an investment.


Bonjour,
Je n'arrive pas à voir le nom des sociétés sur vos slides bleues alors que je suis abonné.
Comment faire pour les visualiser ?
Merci.
Nice article, however, for a few of those industries, I would be worried about influential data points - I suspect a few of these points would have high Leverage or large Cook's Distance values, so there is possibly a risk of confirmation bias here as a consequence.
You could check whether the regression coefficient is statistically significant and whether any of the data points are causing undue influence. If so, those industries may require more data to bolster the hypothesis.
Overall, though, very interesting - thank you for taking the time to compile