


Monthly Portfolio Update - July 2024
An excellent performance for both large-cap and small-cap portfolios

Hello fellow investor,
In this section, I present a transparent monthly update of my portfolio. It adheres to my investment strategy, which you can find here. Additionally, I have detailed my approach to Total Shareholder Return (TSR) in this article.
This presentation is divided into several parts:
Global view of the portfolio’s valuation and metrics
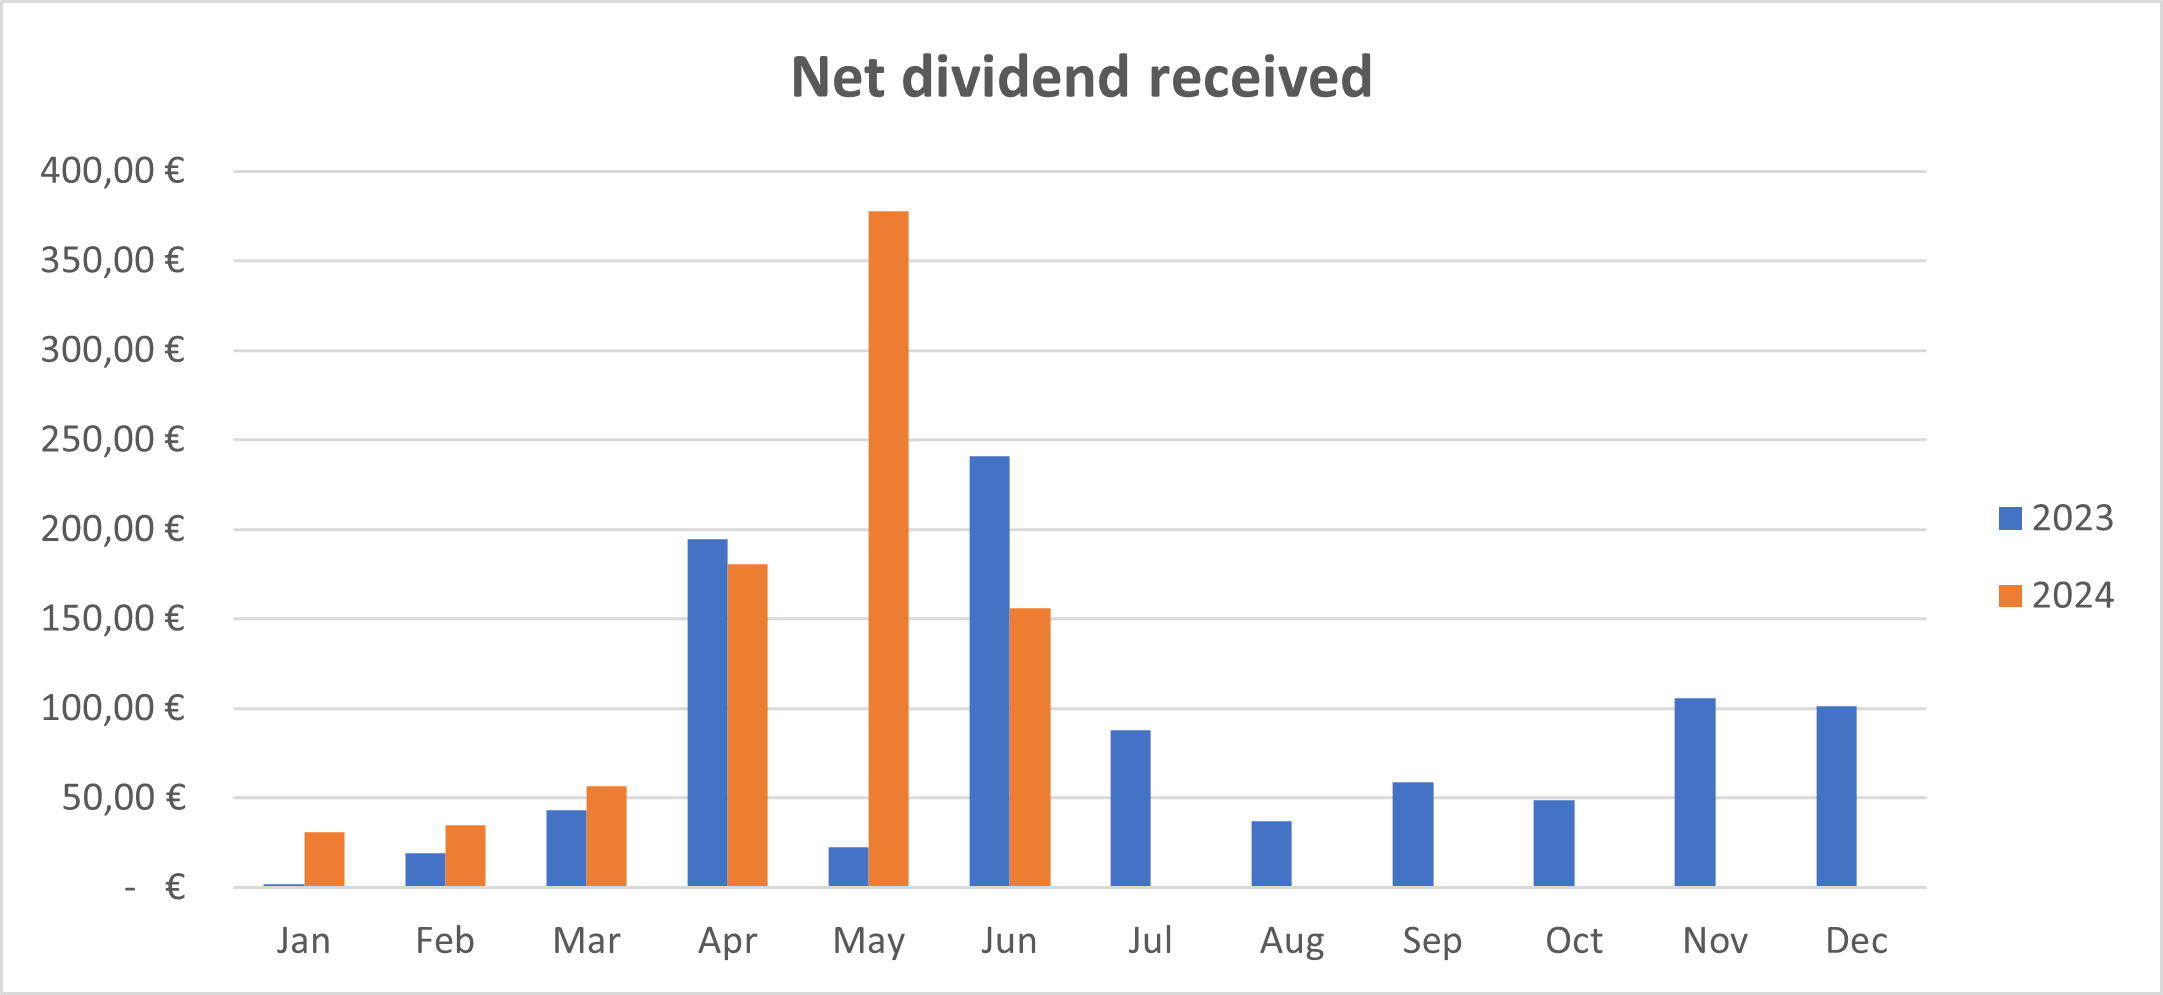
For dividend enthusiasts, a presentation of the Projected Annual Dividend Income (PADI) and a monthly calendar
Sector and geographical breakdown
For paid subscribers, there is also:
An explanation of the month's movements
A review of the month's news
A presentation of current portfolios (small-cap and large-cap)
My reinforcement price for potential stock purchases
My fair price estimation
And, of course, access to all my content, including stock deep dives, industry analyses, screeners and scoring, and real-time updates on my buy/sell movements
Please note that my portfolio is denominated in euros, making it subject to exchange rate fluctuations, particularly the euro-dollar exchange rate.
Overall performance

A good performance in June (+2.57%) despite some impacts in the French market due to the political uncertainties.

Erratum: I made an error in my Excel sheet when calculating the portfolio returns. I neglected to include the first month's portfolio, during which the Altium takeover occurred, significantly impacting my performance. The chart is now the good one
The small-cap portfolio, which began in February 2024, is performing well. It gained 4.46% this month (compared to 4.47% in May) and has achieved a total return of over 21% since inception.
Valuation and metrics

This month I added 1,000€ in my big cap portfolio and 2,800€ in my small cap portfolio. With a positive performance, this explains the significant growth of the portfolios.
Here are the portfolio’s key metrics (weighted average):
Past growth: 14.2% / Estimated future growth: 10.4%
Net profit margin: 25.8%
ROE: 40.9% / ROIC: 24.4%
Debt leverage: -0.05x EBITDA (so average net cash position)
PE: 29.5x / PE Y+2: 22.0x
FCF yield: 3.85% / FCF yield Y+2: 5.24%
Dividend yield: 1.41%
Dividend growth: 10.1%
Buybacks: 0.79%
Expected TSR: 12.0%
If you compare with last month’s metrics, they are significantly better due to some rebalancing and investment in better stocks. This is part of the investment journey: continuous improvement and being able to understand that your choices can be improved.
Please note that I am always careful in my TSR calculation to add a margin of safety.
Focusing solely on my small-cap portfolio, here are the key metrics (weighted average):
Past growth: 21.2% / Estimated future growth: 16.1%
Net profit margin: 24.0%
ROE: 44.6% / ROIC: 32.8%
Debt leverage: -0.78x EBITDA (so average net cash position)
PE: 22.5x / PE Y+2: 16.3x
FCF yield: 5.81% / FCF yield Y+2: 9.07%
Dividend yield: 2.30%
Dividend growth: 12.9%
Buybacks: -0.03% (dilution)
Expected TSR: 17.1%
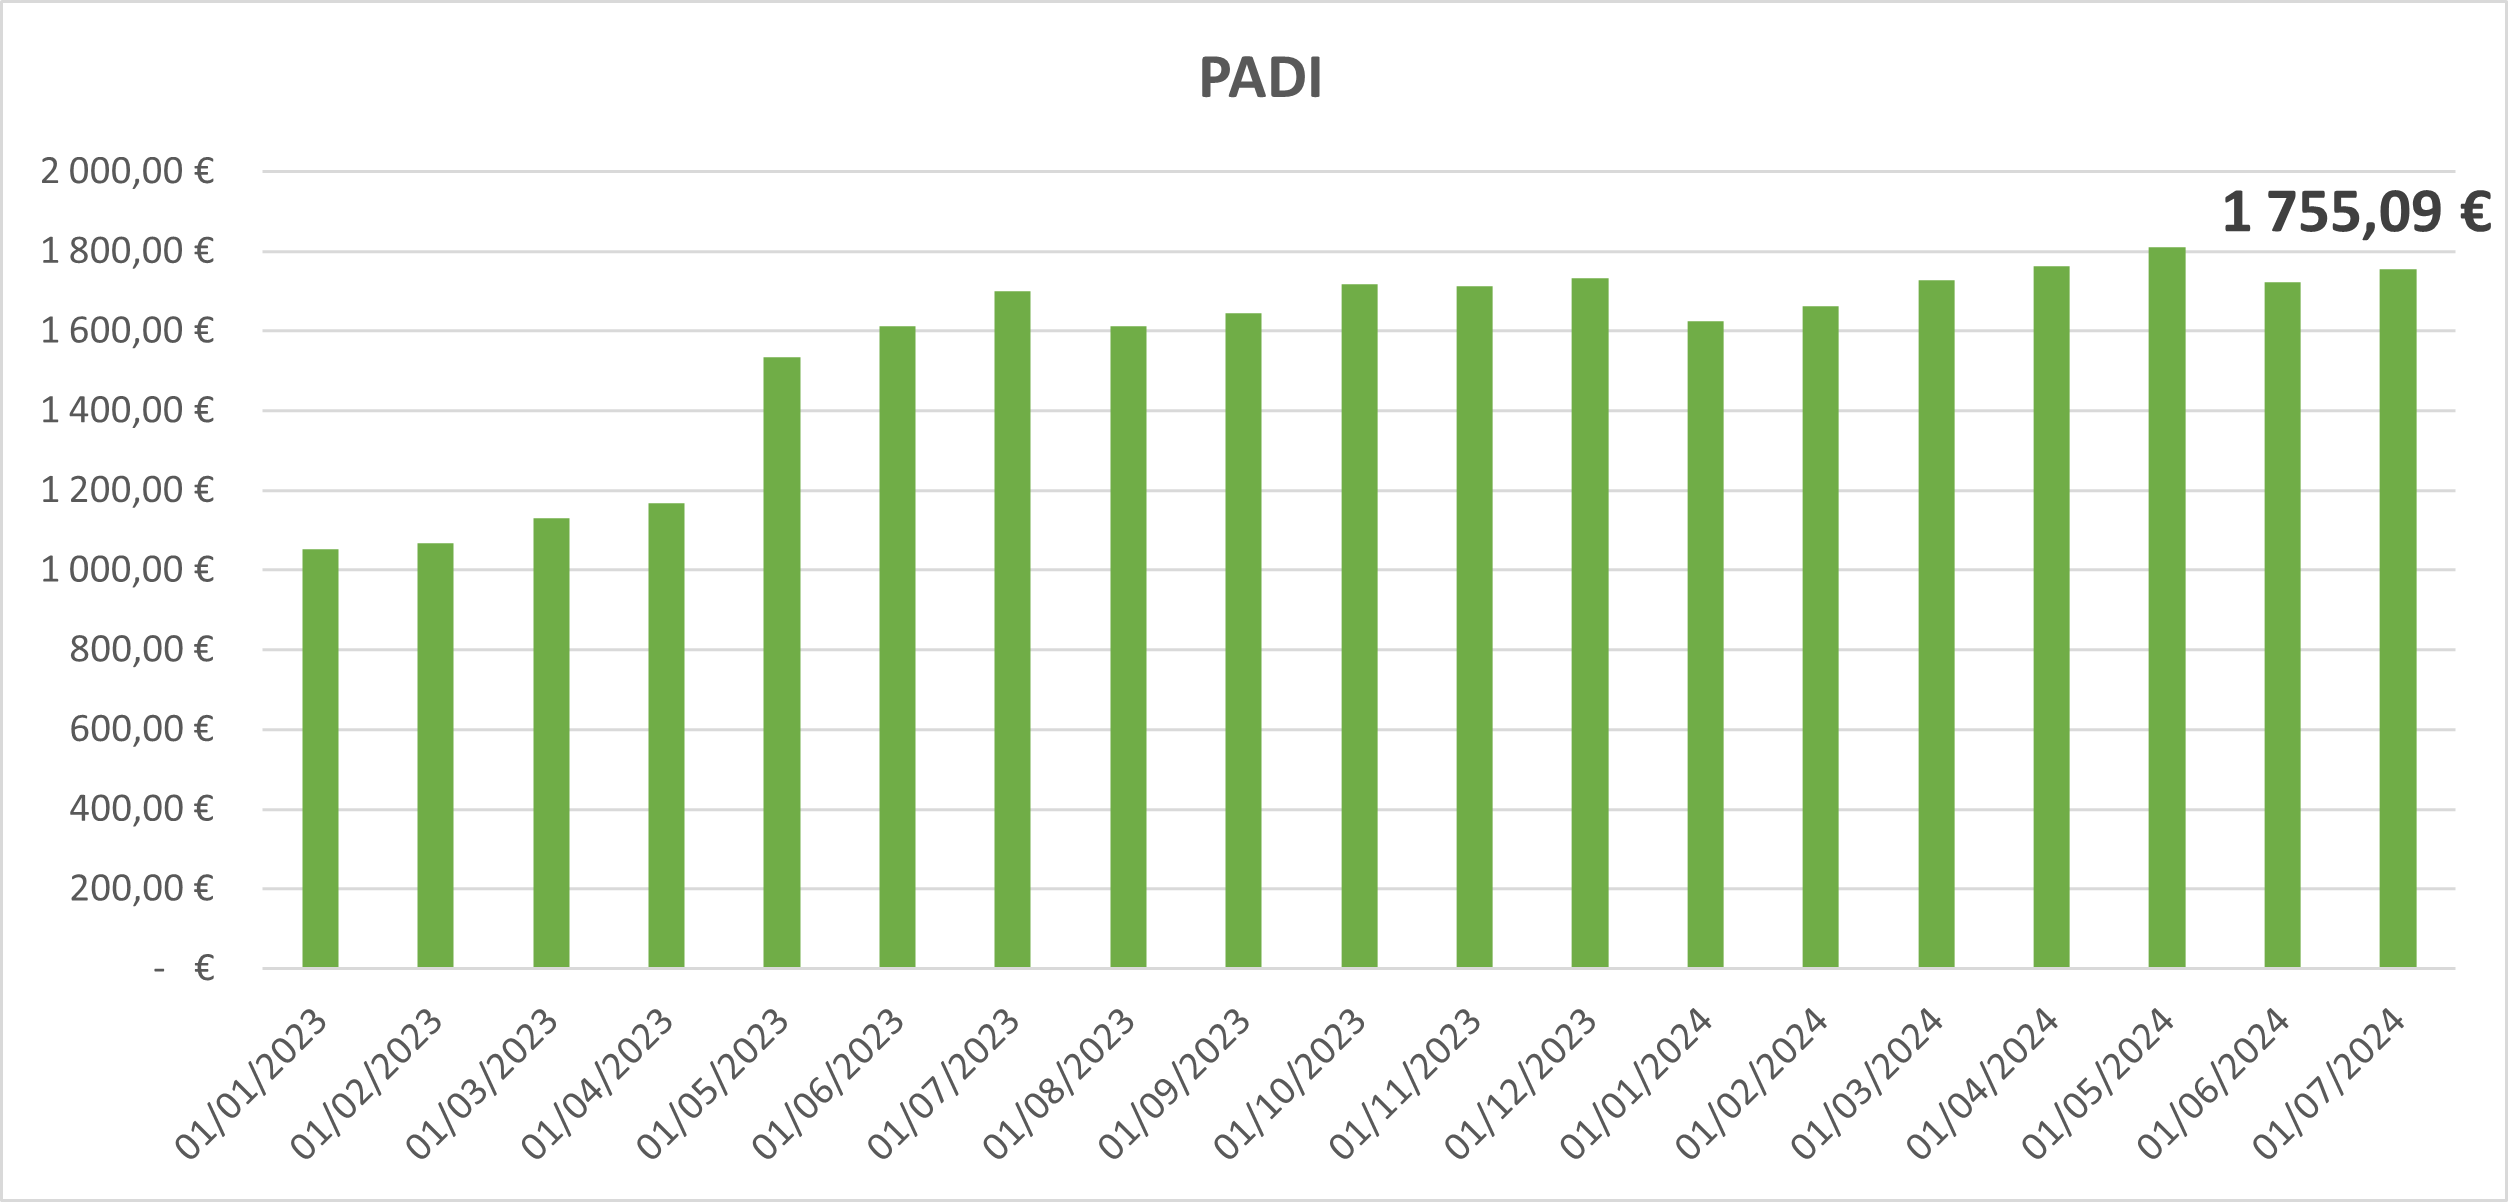
PADI slightly increased despite the sale of 1 high-dividend stock.
And now it is time to discover the 2 portfolios (stocks and news)
Keep reading with a 7-day free trial
Subscribe to Quality Stocks to keep reading this post and get 7 days of free access to the full post archives.