

After Lululemon released its latest earnings report, the immediate market response was strong: the stock dropped almost -20%. On the surface, the company did not post catastrophic results. In fact, earnings were decent by most conventional standards. Revenue met expectations, and the brand remains a dominant player in the athleisure space. So why did investors flee?
In this article, we will unpack the less obvious but critical indicators that likely triggered the sell-off. From guidance changes to inventory trends and geographic slowdowns, we will highlight the overlooked metrics and investor anxieties that explain why Wall Street hit the brakes on Lululemon.
A first look at the earnings
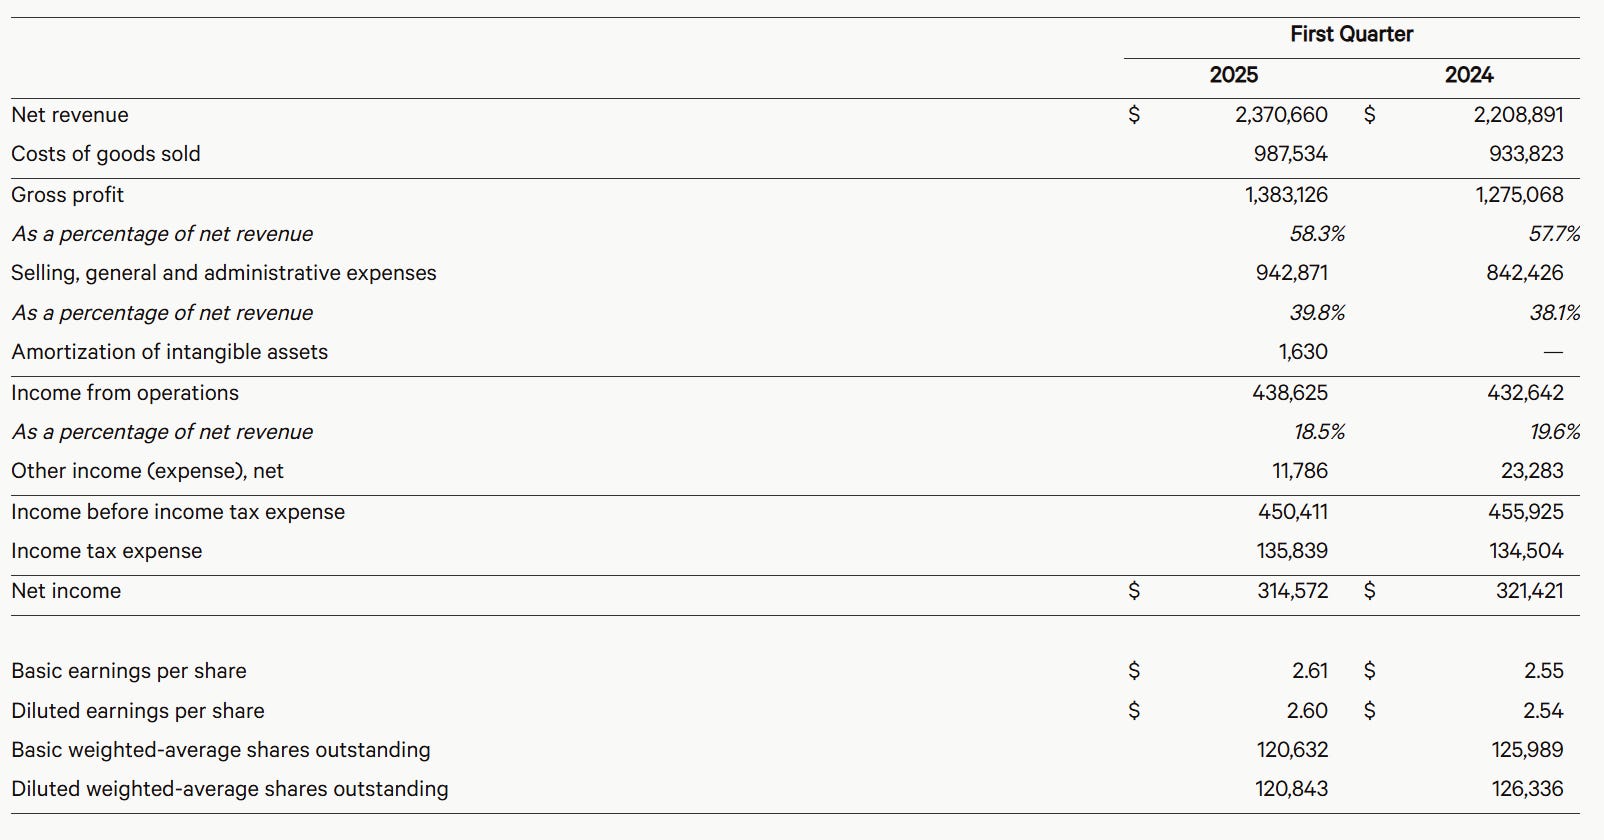
At first glance, Lululemon’s earnings look solid, especially given the challenging economic backdrop. Sales were up 7.3%, and earnings per share grew 2.3% YoY. That is broadly in line with consensus estimates.
Digging into the details, the results show a mixed picture: while net revenue in the Americas grew by a modest 3%, international sales surged 19%, signaling strong global momentum.
The gross profit (sales - COGS) is even higher (58.3% vs 57.7% a year ago). Yet despite this, the market reaction was sharply negative.
What is displeasing the market?
Several elements in Lululemon’s earnings report help explain the market’s negative reaction:
Rising operating costs. While gross margin improved, SG&A (Sales, General & Administrative) expenses climbed to 39.8% of revenue, up from 38.1% a year ago, signaling less efficient cost management
Earnings quality questioned. EPS rose 2% YoY, but this gain is largely due to a 4.5% drop in share count. In reality, net income declined by more than 2% YoY, which is a more meaningful signal of profitability pressure
Weaker EPS guidance. While revenue guidance remains unchanged, EPS guidance was revised down sharply
Q2 25. Now projected at $2.85–$2.90, well below analyst expectations of $3.29
FY25: Lowered to $14.58–$14.78, from the previous range of $14.95–$15.15
Tariff pressures ahead. Gross margins are expected to face headwinds as tariffs re-emerge, a particular concern since much of Lululemon’s production remains concentrated in Asia
US sales weakness. Comparable sales in the US, which still accounts for about 75% of the company’s business, declined 2%, raising concerns despite impressive 19% international growth
While all of the above factors are important, they are not the most concerning in my view. The bigger issue lies in a more subtle but telling signal: softening demand, visible through the supply chain lens
Hidden warning in the supply chain
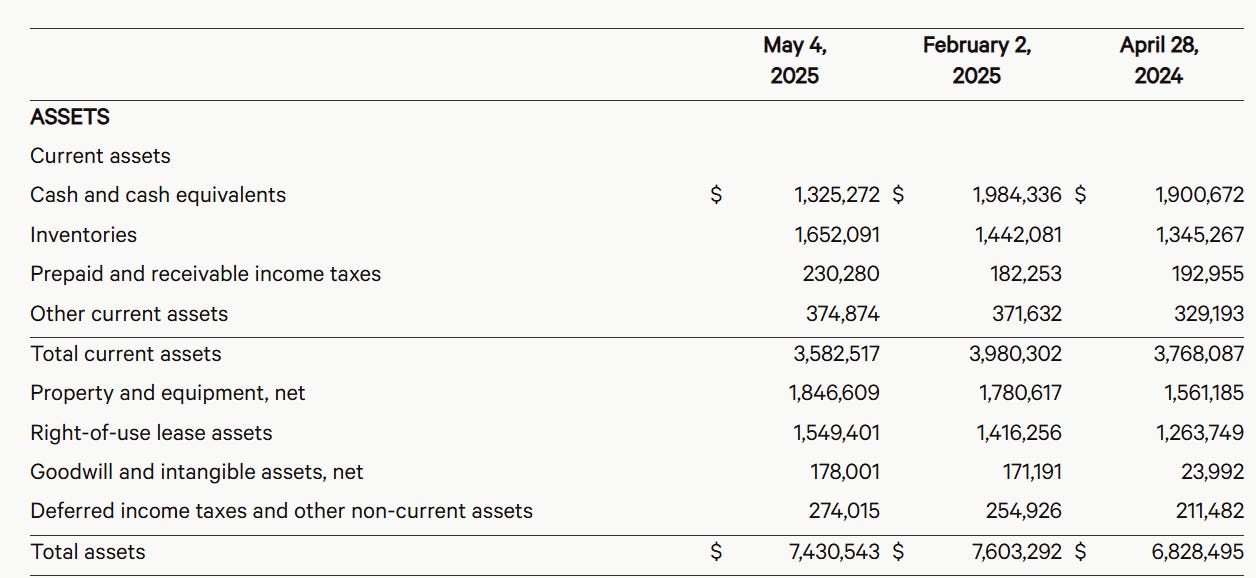
One of the most telling indicators in Lululemon’s latest earnings report lies in a single number: inventories are up 23% YoY, while sales grew only 7% over the same period (and comparable US sales decreased 2%)
To understand why this matters, it is important to break down how the supply chain works and what this disconnect might be signaling about future demand.
At the start of the supply chain is forecasting, the process by which a company estimates future demand. These forecasts draw on multiple inputs: last year’s sales, marketing initiatives, store footprint, and broader market dynamics.
Based on the forecast, the company sets a supply plan: how much product needs to be manufactured and shipped. For Lululemon, this step is especially critical because most of its production is based in Asia, creating long lead times and limited ability to make short-term adjustments.
If the products are core or recurring items, forecasts may be fine-tuned against current inventory levels. Once finalized, supply flows into the distribution system (first to warehouses, then to retail stores or e-commerce fulfillment) often using adaptive allocation strategies to respond to regional demand.between stores and distribution channels
In this case, a 23% increase in inventory relative to only 7% sales growth suggests the forecast was too optimistic, and demand may be weaker than expected. When inventory accumulates faster than it moves off shelves, two problems emerge:
It signals softer underlying demand
It raises the likelihood of discounting to clear excess stock, which puts pressure on margins
While we are not yet at a crisis point (and demand could still rebound) this kind of inventory mismatch is often a quiet early warning of tougher quarters ahead.
This is not without precedent. In Q3 23, Nike’s inventories jumped 43% YoY, while North American sales declined by 5%. Fiscal year 2023 marked the peak of Nike’s revenue at $51.2B, with FY25 expected to fall to $46B. The inventory spike signaled the beginning of several challenging years ahead.
Lululemon’s current position may not be as severe, but the pattern is familiar and worth watching closely.